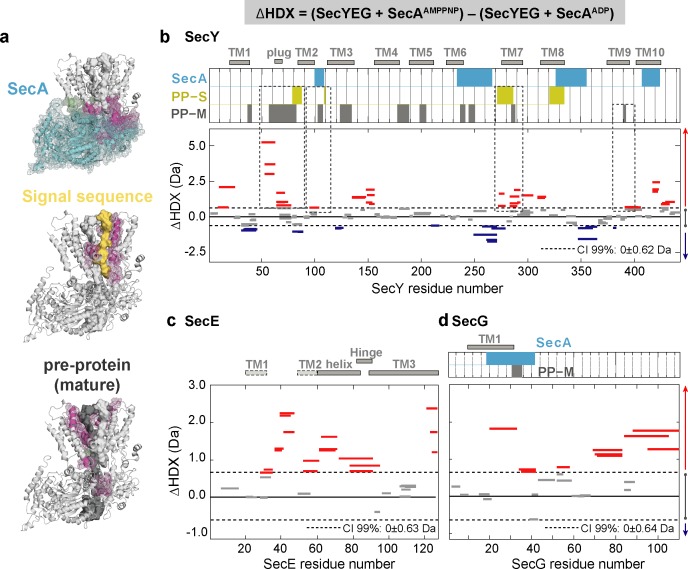
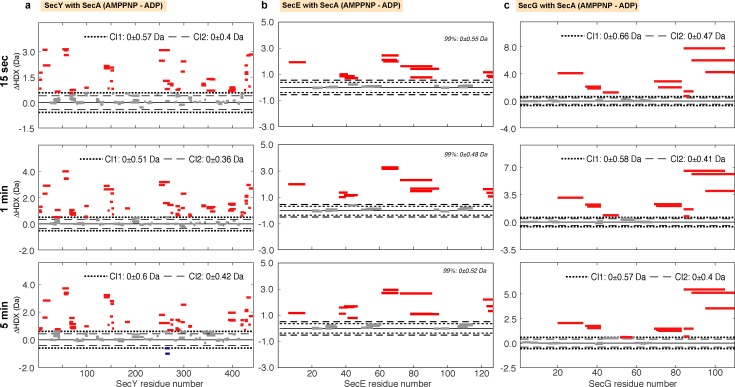
Figure 3. Impact of nucleotides on the conformational dynamics of SecY, SecE and SecG.
(a) Structures of the SecA-SecYEG complex highlighting the contact sites of SecY (pink) and SecG (green) with SecA (cyan), signal sequence (PP-S; yellow) and pre-protein (PP-M; grey). (b-d) Significant sum differences in relative deuterium uptake (ΔHDX = AMPPNP-ADP) of (b) SecY, (c) SecE and (d) SecG in the presence of excess SecA at 30 min of deuteration. Regions interacting with SecY (b) and SecG (d) are highlighted: SecA, pre-protein mature domain (PP-M) and pre-protein signal sequence (PP-S); colour coding as in (a). Confidence intervals (CI; 99%) are shown as grey dotted lines. Red and blue bars indicate structural stabilisation (positive ΔHDX) and destabilisation (negative ΔHDX) of peptides, respectively. Grey bars indicate peptides with insignificant ΔHDX. Dashed boxes in (b) highlight regions interacting with the pre-protein signal sequence (PP-S) and the mature pre-protein (PP-M). Detailed information of HDX-MS data is provided in Supplementary file 2.


