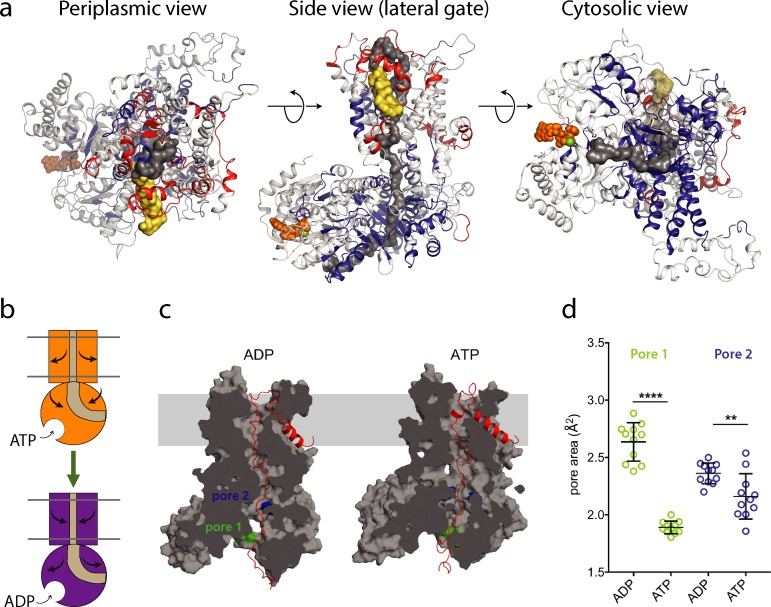
Figure 4. ATP-regulation of channel size.
(a) Periplasmic, membrane perpendicular and cytosolic views of the SecA-SecYEG-preprotein complex model, with ΔHDX of the peptides mapped onto the structure. The translocon complex is coloured light grey, with H-bonding destabilised and stabilised regions in red and blue, respectively. The pre-protein is shown in yellow (signal sequence) and dark grey (mature). ATP is shown as orange spheres. (b) Schematic summarising the primary outcomes from the data here. (c) Snapshots of SecA-SecYE with an engaged pre-protein after 1 µs all-atom MD simulation (Corey et al., 2019). SecA-SecYE is shown as grey surface and has been slabbed to show the pre-protein channel through both SecA and SecY. The pre-protein is shown as red cartoon, and was absent for the cavity size analysis in panel (d). The positions of the conserved SecA pores have been highlighted; pore 1 (green) and pore 2 (blue). Visual analysis suggests that pore 1 is more constricted in the ATP state (d). Quantification of the pore size, using snapshots every 25 ns from 750 to 1000 ns: both pores are tighter in ATP bound state (pore 1 means are 1.9 and 2.6 Å2, p<0.0001 using a 2 tailed t-test: pore 2 means are 2.4 and 2.1 Å2, p=0.0061).

