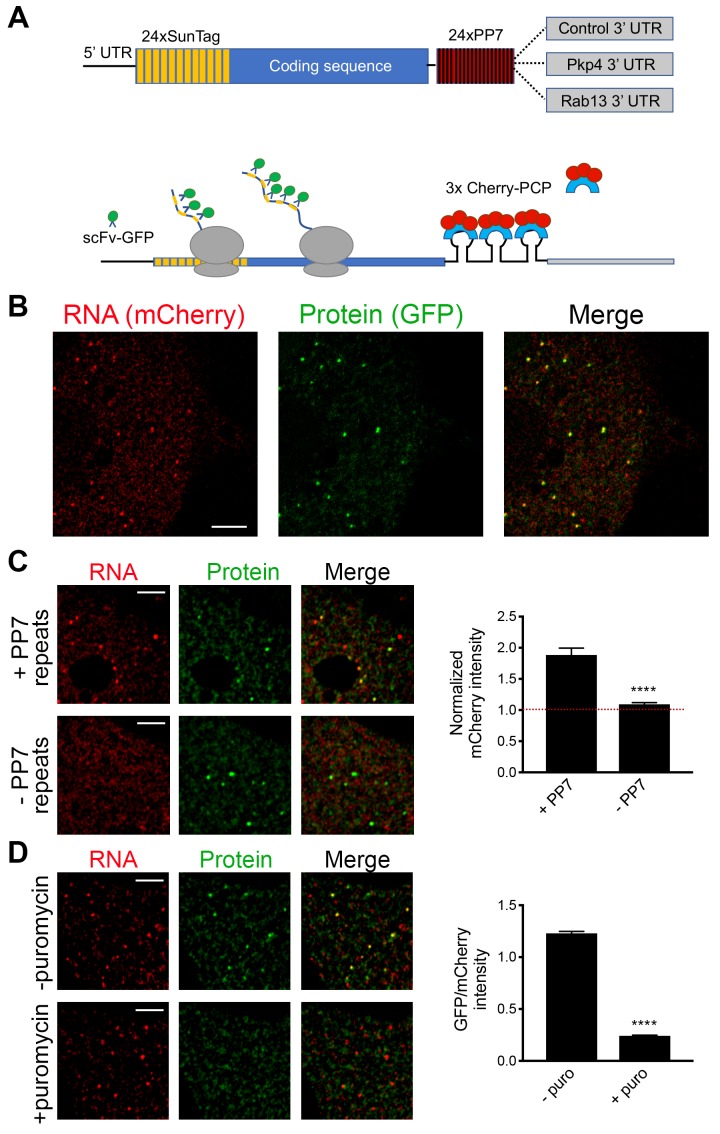
Figure 3. Validation of single-molecule translation reporter assay.
(A) Schematic of translation reporter constructs for labeling of RNA and nascent protein chains. (B) Live cell imaging snapshot of a cell expressing the control translation reporter. The mCherry channel detects the 3x-mCherry-PCP protein. Bright spots correspond to RNA molecules. Diffuse signal results from free 3x-mCherry-PCP. The GFP channel detects the scFv-GFP antibody. Bright spots overlap with RNA spots (merge image) and correspond to nascent protein at translation sites. Diffuse signal results from free scFv-GFP or scFv-GFP bound to the reporter protein released after translation. (C) Cells expressing the control translation reporter, containing PP7 repeats (+PP7), or a reporter without PP7 repeats (-PP7), were imaged live. mCherry intensity overlapping with translation sites (GFP spots) was measured and normalized to the intensity observed in nearby cytoplasmic regions with diffuse signal. Value of 1 indicates that there is no mCherry concentration at translation sites. (D) The same cytoplasmic areas, of cells expressing the control translation reporter, were imaged before and after puromycin addition. GFP/mCherry intensity of individual spots was calculated as a measure of translational efficiency. n > 100 (C) and n > 500 (D) spots from multiple cells observed in three independent experiments; error bars: standard error; ****: p-value<0.0001 by Student’s t-test. Scale bars: 5 μm.


