
Figure 5. APC-dependent RNAs associate with heterogeneous clusters at the tips of protrusions.
(A-C) The indicated endogenous RNAs were detected by in situ hybridization. Signal intensities of observed spots are shown in the associated surface plot profiles, which also indicate the size of each image in microns. In internal regions all detected RNAs exist as single molecules. At the tips of protrusions, they exist in clusters of multiple RNAs. (D) In situ hybridization images and surface plot profiles of endogenous Ddr2 and Net1 RNAs detected in the same cell. Peripheral clusters can contain distinct RNA species. (E) In situ hybridization images and surface plot profiles of endogenous Pkp4 RNA and polyA RNA detected in the same cell. Peripheral clusters are characterized by a visible accumulation of polyA RNA. (Note that only enlarged views of individual protrusions are shown in panels A-E). (F) Whole cell masks of cells processed for FISH were used to derive a 2 μm-wide peripheral edge mask. (G) Whole-cell FISH images of the indicated endogenous RNAs (for additional examples see Figure 5—figure supplement 1). Scale bars: 15 μm. (H) For each RNA, signal intensity histograms of all detected particles found within the 2μm-wide peripheral edge area, were used to group particles into single RNAs or RNA clusters (see Figure 5—figure supplement 1 ). Table lists number of particles in each category for the indicated RNAs. p-values based on Fisher’s exact test against Arpc3 RNA. (I) Percent of overlap of the indicated RNA clusters with polyA clusters. n = number of particles observed in ca. 25 cells.

Figure 5—figure supplement 1. Intensity histograms of endogenous APC-dependent or control RNAs.

Figure 5—figure supplement 2. Amount of APC-dependent RNAs per cell.
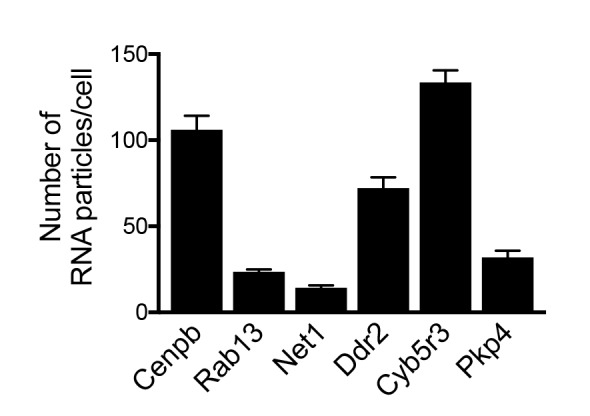
Figure 5—figure supplement 3. Peripheral cluster formation by MS2-reporter RNAs.
