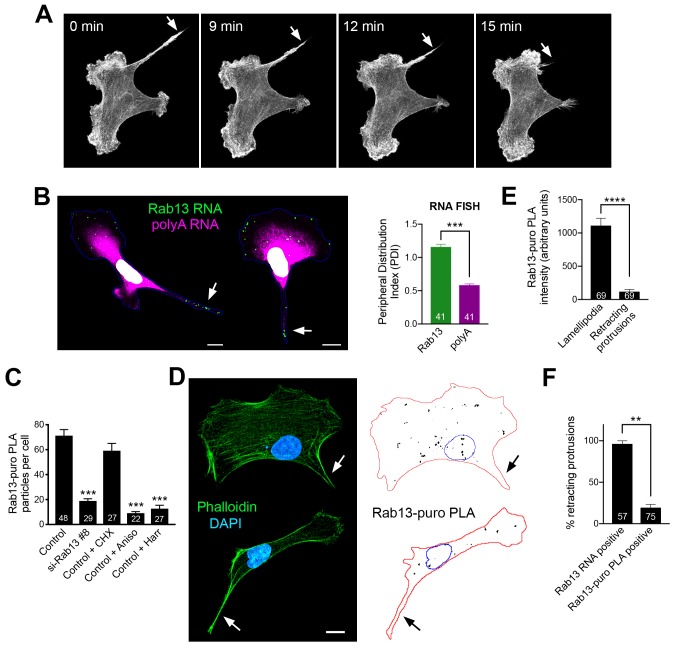
Figure 8. Peripheral Rab13 RNA is silenced at retracting protrusions.
(A) Snapshots of time lapse imaging of MDA-MB-231 cells expressing Lifeact-GFP. Arrow points to protrusion that retracts within a few minutes. The full-length movie of this sample is presented in Video 11. (B) In situ hybridization of Rab13 and polyadenylated (polyA) RNA in MDA-MB-231 cells and PDI quantitations. Arrows point to Rab13 RNA in retracting protrusions. (C) Quantitation of Rab13-puro-PLA signal in MDA-MB-231 cells under the indicated conditions. (D) Representative images of Rab13-puro-PLA and phalloidin staining in MDA-MB-231 cells exhibiting retracting protrusions. Note that Rab13-puro-PLA signal is absent in retracting protrusions (arrows). (E) Rab13-puro-PLA intensity in lamellipodia or retracting protrusions. (See Figure 9A for representative outlines). (F) Percent of retracting protrusions positive for Rab13 RNA or puro-PLA signal based on images such as those shown in (B) and (D). Error bars: standard error. Number of cells analyzed in 2–3 independent experiments are shown within each bar. p-value: **<0.01, ***<0.001, ****<0.0001 by Student’s t-test (B, E) or one-way ANOVA with Dunnett’s multiple comparisons test, compared to control (C). Scale bars: 10 μm.

