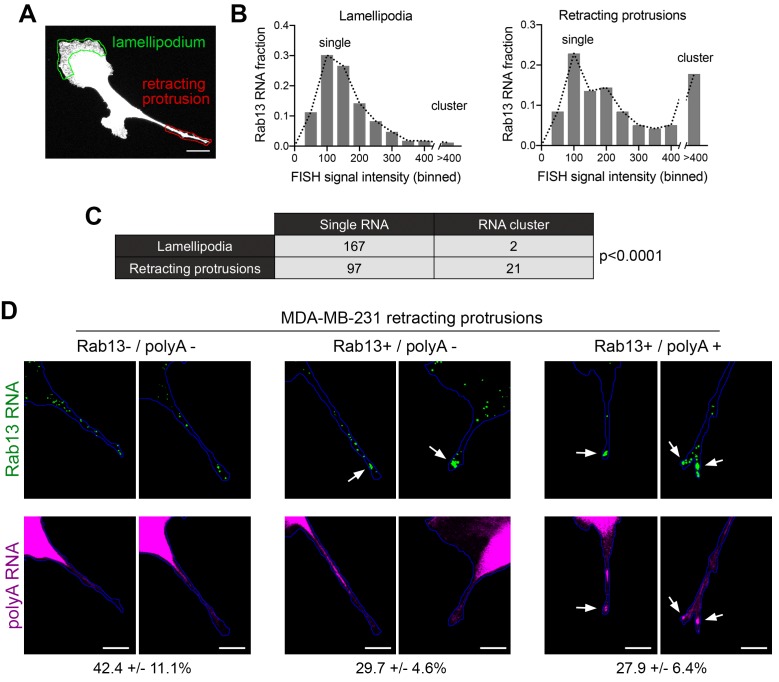
Figure 9. Silenced Rab13 RNA at retracting protrusions can be found in heterogeneous clusters.
(A) Outlines of ‘lamellipodia’ or ‘retracting protrusion’ regions used for quantitations Scale bar:10 μm. (B, C) Frequency distribution histograms of signal intensities (in arbitrary units) of Rab13 RNA particles within lamellipodia or retracting protrusions of MDA-MB-231 cells, as shown in (A). Intensities > 400 were grouped in one bin and indicate RNA clusters. Table lists numbers of single RNAs or RNA clusters observed in 32 cells. p-value by Fisher’s exact test. Essentially identical results were obtained in three independent experiments. (D) Retracting MDA-MB-231 protrusions (outlined in blue) stained for Rab13 and polyA RNAs. Based on the staining pattern, protrusions were grouped into three categories: Rab13-/polyA- do not exhibit visible Rab13 clusters or obvious local accumulations of polyA RNA; Rab13+/polyA- exhibit clusters of Rab13 RNA (arrows) but no obvious polyA clusters; Rab13+/polyA +exhibit Rab13 clusters which coincide with obvious corresponding polyA clusters (arrows). Values indicate average fraction of protrusions in each category ± standard error. n = 60 from two independent experiments. Scale bars: 10 μm.

