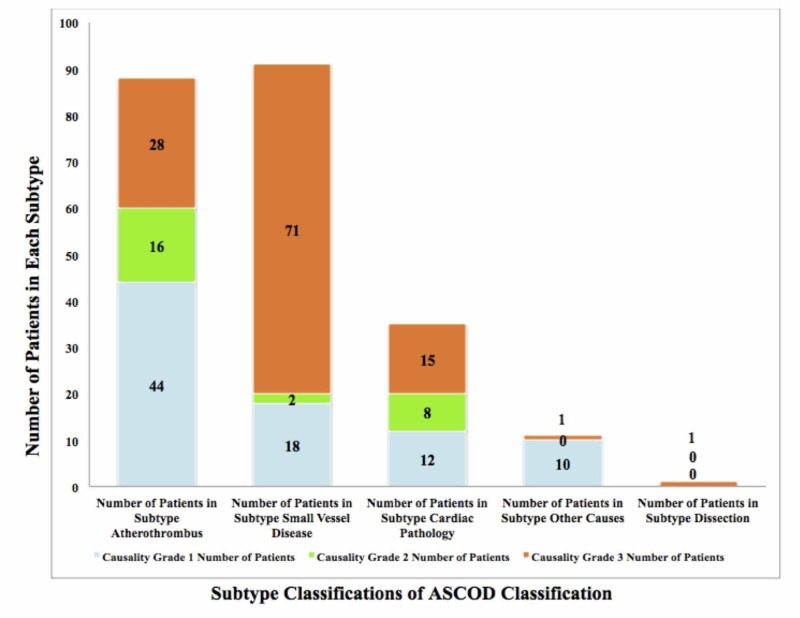
Figure 2. ASCOD Classification of Stroke Patients in the Study.
A bar graph was created to represent patient distribution into different subtypes of the ASCOD classification (seen with bars). Each subtype was then further classified into different causality grades (blue, green, and orange). With the ASCOD classification, it was determined that A was present in 42% of patients (A1 = 44, A2= 16, A3 = 28), S was present in 44% of patients (S1 = 18, S2 = 2, S3 = 71), C was present in 17% of patients (C1 = 12, C2 = 8, C3 = 15), O was present in 5% of patients (O1= 10), and D was present in 1% of patient. The patient population used comprised 209 people.
ASCOD: atherothrombosis (A), small vessel disease (S), cardiac pathology (C), other Causes (O), dissection (D); A1: atherothrombosis grade 1; A2: atherothrombosis grade 2; A3: atherothrombosis grade 3; S1: small vessel disease grade 1; S2: small vessel disease grade 2; S3: small vessel disease grade 3; C1: cardiac pathology grade 1; C2: cardiac pathology grade 2; C3: cardiac pathology grade 3; O1: other causes grade 1.

