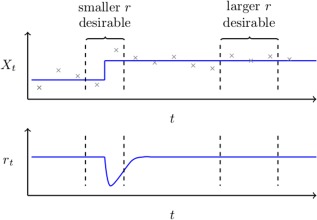
Figure 1.

Top: Measurements of a non‐stationarity univariate random variable, , are shown in grey together with the true mean in blue. This figure serves to highlight how the optimal choice of a forgetting factor or window length may depend on location within a dataset. It follows that in the proximity of the change‐point we wish to be small in order for it to adapt to change quickly. However, when the data is itself piece‐wise stationary, we wish for to be large in order to be able to fully exploit all relevant data.
Bottom: An illustration of how an ideal adaptive forgetting factor would behave; decreasing directly after a change occurs and quickly recovering thereafter. [Color figure can be viewed at http://wileyonlinelibrary.com.]
