
Figure 6.
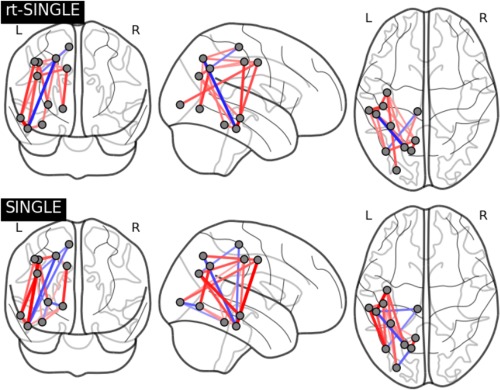
Task activation networks for rt‐SINGLE (top) and SINGLE (bottom) algorithms, respectively. Present edges had statistically significant correlations with task HRF after correction for multiple comparisons. Red edges indicate edge strength increased during task while blue edges indicate edge strength decreased during task. Eleven bilateral regions where used as described in Table 1. In order to facilitate interpretation of the plot, only the right‐hemispheric coordinates are shown here. We note there is consistent activation pattern across both algorithms, particularly across nodes nodes corresponding to the motorsensory areas. Associated summary graph statistics of the task positive and task negative networks estimated with rt‐SINGLE and SINGLE are provided in Supporting Information Table 2. [Color figure can be viewed at http://wileyonlinelibrary.com.]