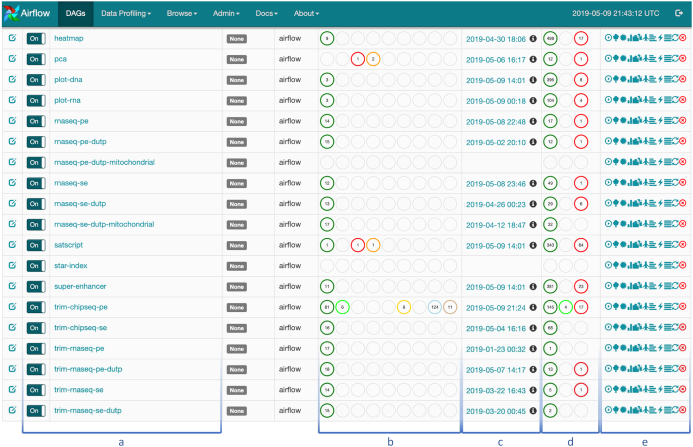
Figure 3:
Airflow web interface. The DAGs tab shows the list of the available pipelines (a) and their latest execution dates (c) and number of active, succeeded, and failed runs (d) and workflow step statuses (b). The buttons on the right (e) allow a user to control pipeline execution and obtain additional information on the current workflow and its steps.

