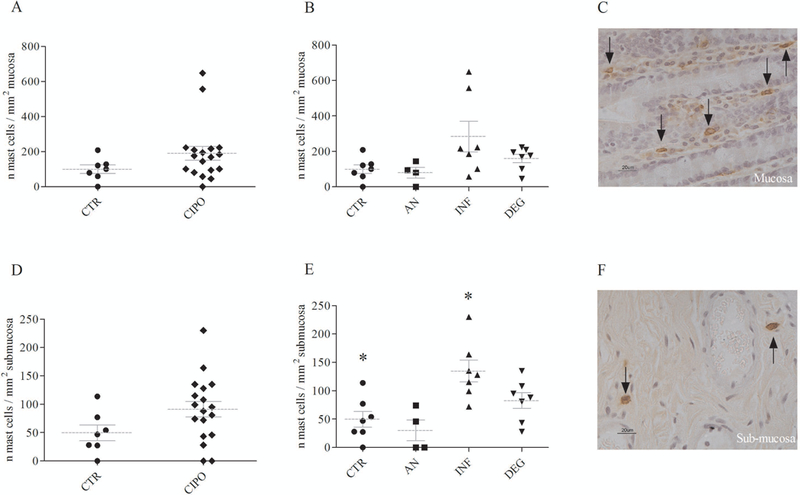
Fig 5. Mast cells quantitative analysis.

Mast cells counted per mm2 of mucosa have been quantified A) in CIPO; and B) in IHC subgroups; C) Example of tryptase positive cells infiltrating the mucosa. Mast cells counts are expressed per mm2 of sub-mucosa D) in CIPO; and E) in IHC subgroups *P=0.0039; the same symbol superscript in the column indicates the pair with a statistically significant difference. F) Example of tryptase positive cells infiltrating the sub-mucosa.
