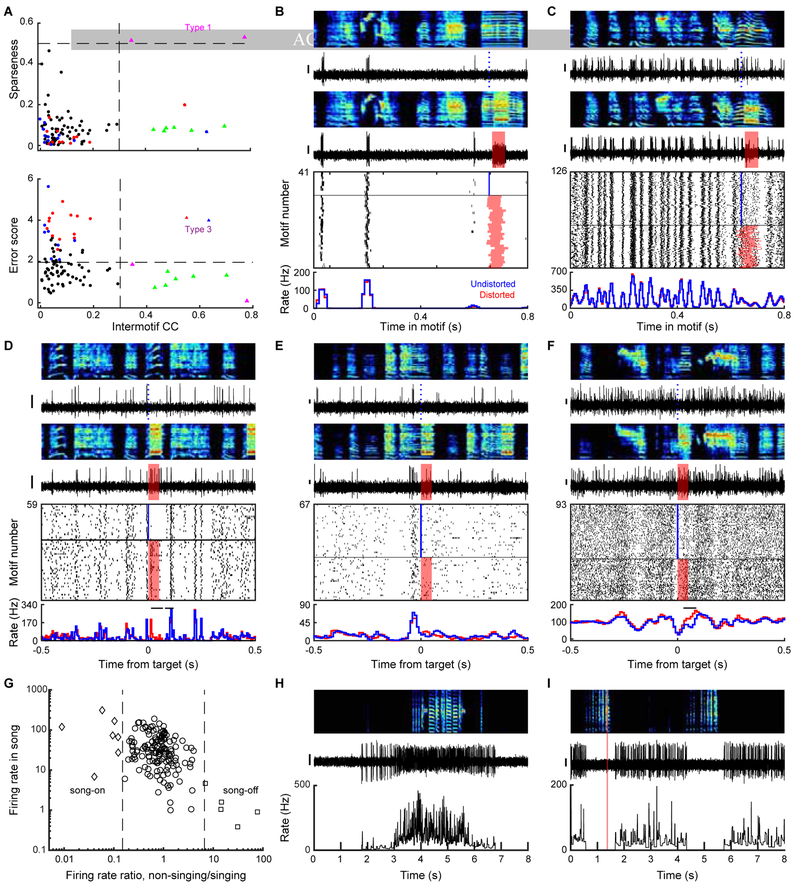
Figure 4. VP neurons exhibit temporally precise song-locked activity during singing. See also Figure S3.
(A) Top: sparseness of song-locked VP neurons plotted against the intermotif correlation coefficient (IMCC). Dashed lines: IMCC=0.3 (vertical) and sparseness=0.5 (horizontal). Bottom: Maximum error score (absolute z-scored difference between distorted and undistorted trials) plotted against IMCC. Dashed lines: IMCC=0.3 and error score=1.96. (B to F) Top to bottom: spectrograms, spiking activity during undistorted and distorted trials, corresponding spike raster plots and rate histograms for a VP neuron with sparse, temporally precise discharge (B), one with time-locked bursts that tile the song (C), one with time-locked bursts and error response (D), one with significant rate maximum immediately before target time (E), and one with significant rate minimum at target time (F). Horizontal bars on top of rate histograms indicate significant difference between distorted and undistorted firing (p<0.05, WRS test). (G) A scatter plot of the mean firing rate during singing plotted against the ratio between mean firing rates during non-singing and singing periods identified VP neurons gated by singing state. (H-I) Top to bottom: spectrograms, spiking activity, and corresponding instantaneous firing rate (IFR) for a song-on neuron which fired at high rate during singing, but silent outside song (H) and a song-off neuron which abruptly stopped firing during singing (I). Scale bar for spiking activity in (B-F, H, I) is 0.15 mV.

