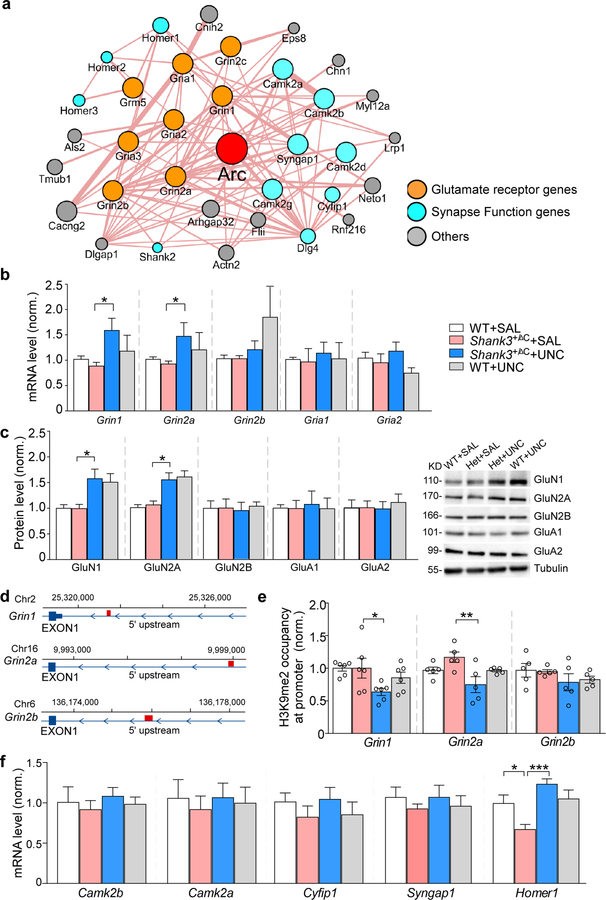
Figure 6. Arc-interacting proteins contribute to the rescuing effects of UNC0642 in Shank3-deficient mice.
(a) Arc-interacting protein networks derived from CYTOSCAPE. (b, c) qPCR and immunoblotting data showing the mRNA (b) or protein (c) level of Grin1 (GluN1), Grin2a (GluN2A), Gria2b (GluN2B), Gria1 (GluA1), Gria2 (GluA2), and Shank3 (Shank3) in WT or Shank3+/ΔC mice treated with UNC0642 or saline (n = 6–11/group, * P < 0.05, ** P < 0.01, *** P < 0.001, two-way ANOVA). (d) Diagram showing the location of primers used in ChIP assays (red). (e) ChIP assay data showing the enrichment of H3K9me2 at Grin1, Grin2a and Grin2b promoters in PFC from WT or Shank3+/ΔC mice treated with UNC0642 or saline (n = 5–6/group * P < 0.05, ** P < 0.01, two-way ANOVA). (f) qPCR data showing the mRNA level of Camk2b, Camk2a, Cyfip1, Syngap1 and Homer1 in WT or Shank3+/ΔC mice treated with UNC0642 or saline (n = 6–8/group, * P < 0.05, *** P < 0.001, two-way ANOVA). Data are presented as mean ± sem.

