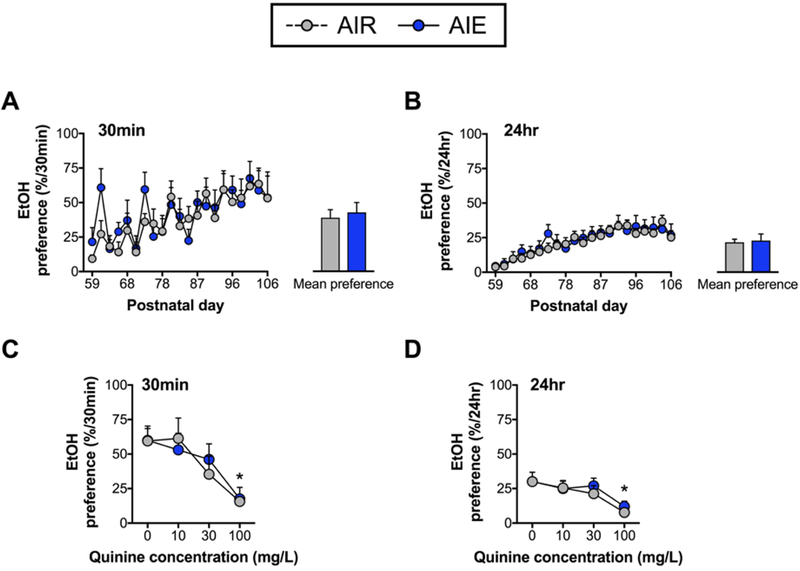
Figure 4. Ethanol preference during the first 7-week period of two-bottle choice drinking and quinine testing.
Measurement of ethanol preference at the 30 min (A) and 24 hr (B) time-points during the first 2BC drinking period. Both AIR and AIE exposed rats exhibited escalated preference over drinking days. The mean preference across all drinking days was not significantly different between AIR and AIE exposed rats (bar graph insets). Following the first 2BC drinking period, AIR and AIE exposed rats exhibited comparable preference for quinine adulterated ethanol across increasing concentrations at both the 30 min (C) and 24 hr (D) time points. As indicated by the asterisks, significant suppression of ethanol preference was observed in both AIR and AIE exposed groups at the highest concentration of quinine (100 mg/L) relative to baseline (0 mg/L). *p < 0.05; n = 7-8/group.

