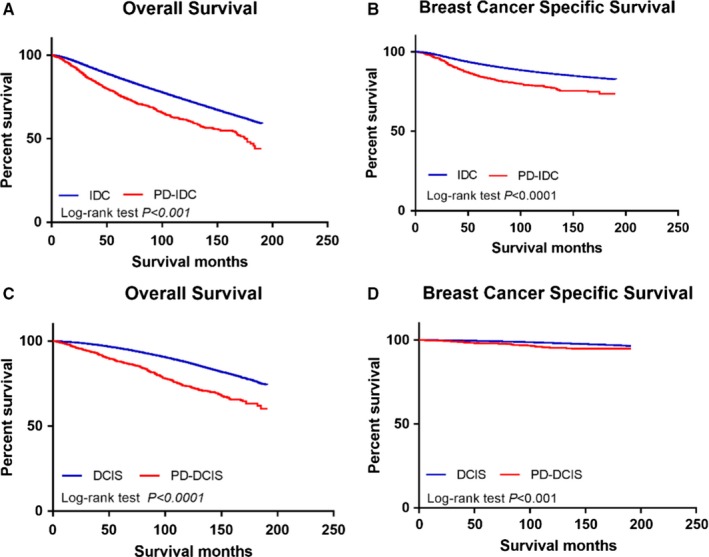
Figure 1.

Kaplan‐Meier curves without adjusting for tumor characteristics and treatment approaches. (A) Overall survival of the PD‐IDC group and the IDC group. (B) Disease‐specific survival of the PD‐IDC group and IDC group. (C) Overall survival of the PD‐DCIS group and the DCIS group. (D) Disease‐specific survival of the PD‐DCIS group and the DCIS group
