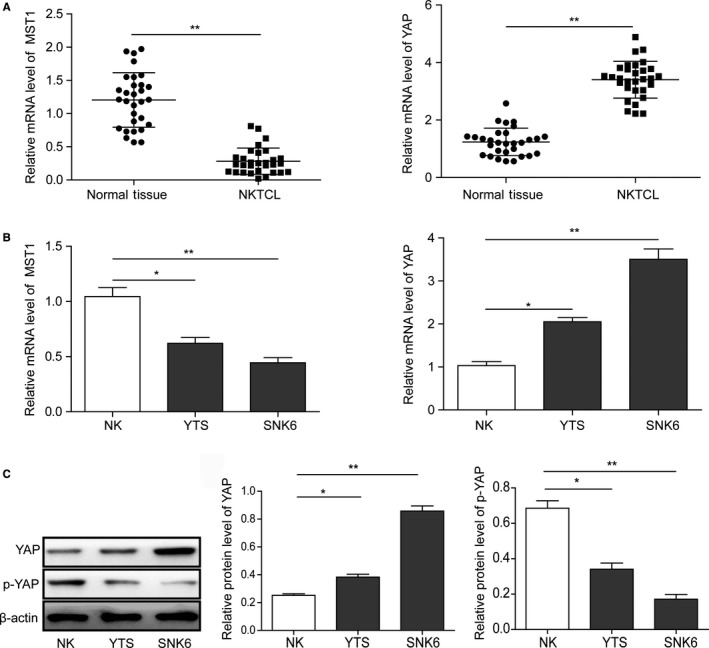
Figure 1.

Expression levels of MST1 and YAP in NKTCL tissues and cell lines. (A) The expressions of MST1 and YAP in 30 pairs of NKTCL samples and corresponding normal tissues, and (B) NKTCL cell lines (SNK6 and YTS) detected by RT‐PCR. (C) Western blot analysis of the protein expression levels of YAP and phosphorylated YAP in NKTCL cell lines. All the results were shown as mean ± SD (n = 3), which were three separate experiments performed in triplicate. *P < 0.05. **P < 0.01
