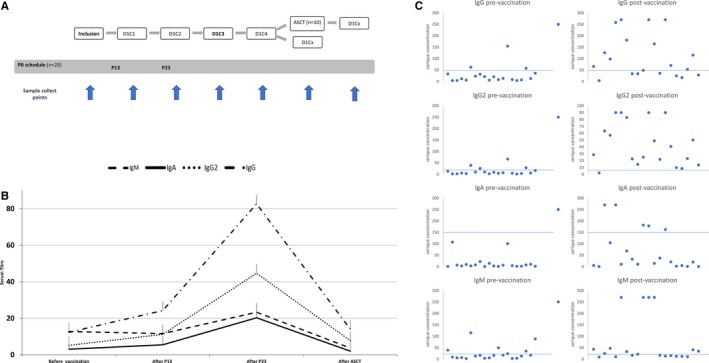
Figure 1.

A, Longitudinal diagram of the vaccination schedule and the sample collect points. Each treatment cycle varied from 21 to 35 days depending of the age of the patient. D represent the day on the cycle and C the cycle number. B, Serum longitudinal profile of all patients. A slightly increase in all subtypes after P13 and a major increase after the P23, all immunoglobulin subtypes concentration decreased after ASCT. The last time point only concerns the eight patients whose Ig levels have been tested after ASCT. C, Anti‐pneumococcal serum concentrations of IgG, IgG2, IgM, and IgA for 20 patients before and after vaccination by P13 and P23. The blue bar represents the threshold antibody level correlated with a protection from invasive disease
