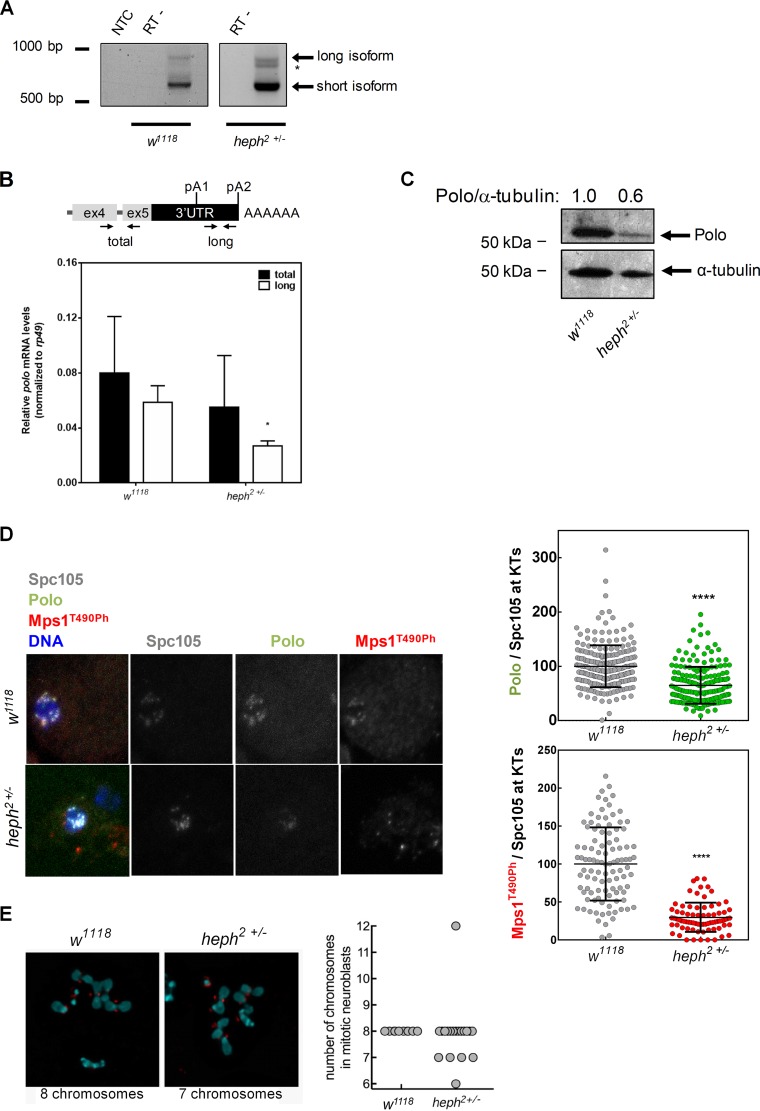
FIG 4.
Heph regulates polo 3′-end formation and protein production. (A) 3′-end mapping of polo in w1118 and heph2/TM6B 0- to 24-h embryos by 3′RACE. polo pA signal usage in the heph2/TM6B mutant shows an additional mRNA isoform (*) compared to the w1118 control. NTC, no-template control; RT−, negative controls. (B) Expression levels of total polo mRNA in heph2/TM6B third-instar larval brains quantified by RT-qPCR. rp49 was used as a housekeeping gene. Error bars show SD from three independent experiments. *, P < 0.05. (C) Representative Western blot showing that Polo protein levels (anti-Polo MA294, 1:40) are decreased in heph2/TM6B mutant neuroblasts. α-Tubulin (anti-α-tubulin DM1A, 1:20,000) was used as loading control and for the semiquantification of Polo by densitometry depicted above each lane. (D) Representative immunofluorescence images and respective quantifications of Polo and Mps1T490Ph levels at kinetochores of dividing third-instar larval neuroblasts from w1118 (control) and heph2/TM6B mutants. Polo and Mps1T490Ph fluorescence intensities were determined relative to the Spc105 signal, which was used as a kinetochore reference. All values were normalized to the control (w1118) mean fluorescence intensity, which was set to 100% (n ≥ 7 kinetochores from at least 10 neuroblasts for each condition). Results are expressed as mean values ± SD, and statistical significance was assessed by the Mann-Whitney test. (E) Representative immunofluorescence images of mitotic neuroblasts from squashed Drosophila melanogaster larval brains with the w1118 and heph2/TM6B genotypes. Spc105 was used as a kinetochore reference. The chromosome content is shown for each representative neuroblast. The graph represents the quantification of chromosome numbers in w1118 and heph2/TM6B mitotic neuroblasts.

