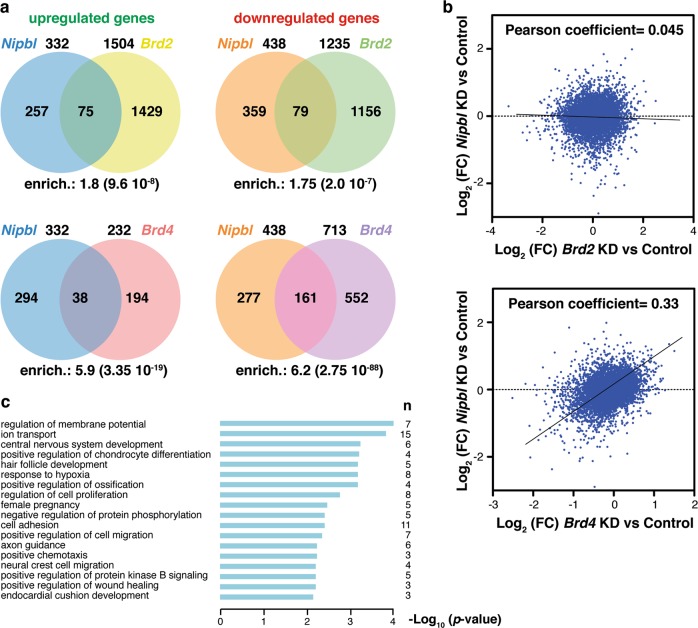
Fig. 3. RNA-Seq analysis uncovers a high overlapping of misregulated genes upon NIPBL and BRD4 depletion.
a Venn diagrams representing overlapping of misregulated genes upon knocking down of the indicated genes. Numbers on the diagrams indicate the total number of misregulated genes in each condition. Enrichment (enrich.) with the associated p-value between brackets, as determined by hypergeometric test, is also indicated for the different comparisons. b Pearson correlation of altered gene expression after Nipbl knockdown, compared with Brd4 and Brd2 knockdowns. FC fold change. c Gene ontology (GO) analysis of commonly downregulated genes upon NIPBL and BRD4 depletion, showing different categories of biological processes. n indicates the number of genes in the different categories

