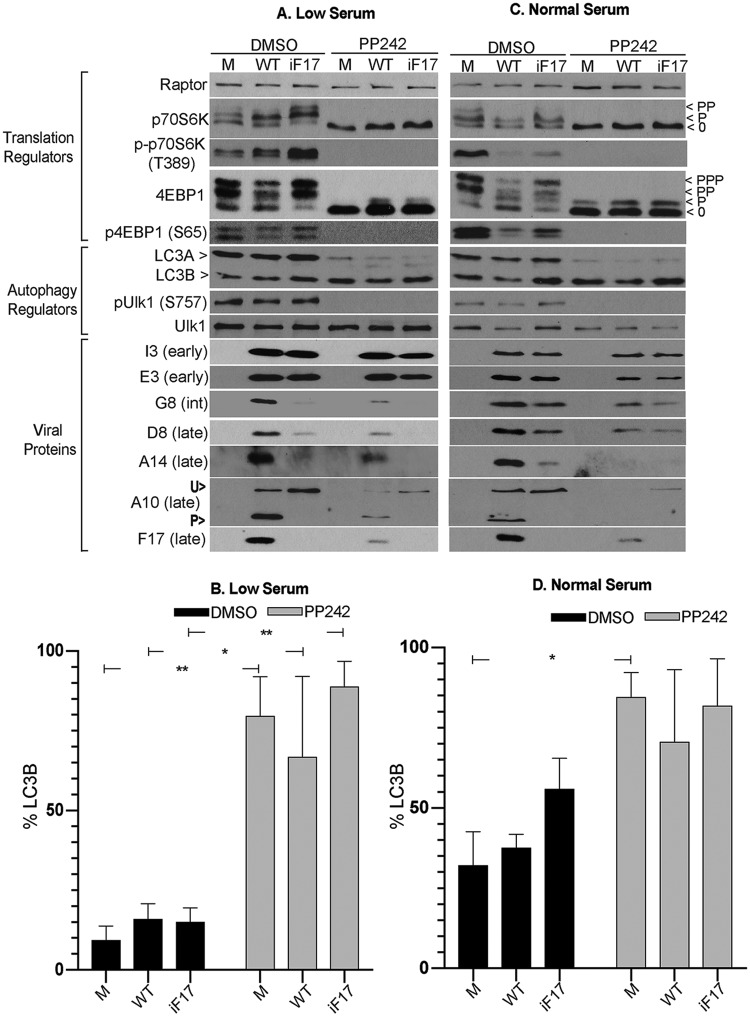
FIG 4.
Effects of poxvirus infection and mTOR inhibition on mTOR substrates and autophagy in MRC5 cells under different growth conditions. (A and B) Confluent cultures of MRC5s cultured in 0.2% FBS medium (low serum) were mock infected (M) or infected with WT or iF17 virus at an MOI of 5 for 30 h. Cells were treated with DMSO or the mTOR inhibitor PP242 (2.5 μM) at 8 h.p.i. (C and D) MRC5s cultured in normal growth medium (normal serum) were infected as described for panels A and B. Cells were treated with DMSO or PP242 (2.5 μM) at 8 h.p.i., and samples were harvested at 30 h.p.i. int, intermediate; U>, unprocessed A10; P>, processed A10. Note that processing of A10 makes the difference in total protein levels between WT and iF17 samples appear smaller due to separation of signals. Fast-migrating nonphosphorylated (0) and slower-migrating species of differently phosphorylated (P) forms of 4E-BP1 or p70S6K are shown. (B and D) LC3B was quantified as the percentage of total LC3 (LC3A and LC3B) using densitometry measurements of autoradiographs. Error bars show SEM. *, P ≤ 0.05; **, P ≤ 0.01. Statistical analysis was performed using ANOVA and Sidak’s test for multiple post hoc comparisons. All data are derived from and representative of at least 3 biological replicates.

