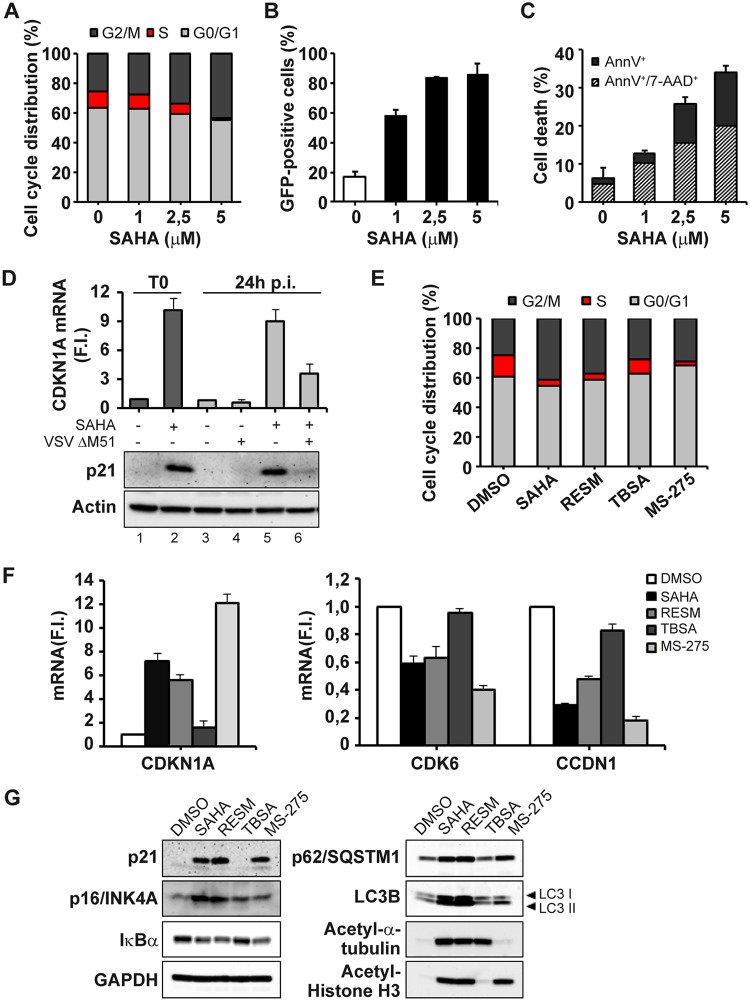
FIG 1.
Inhibition mediated by HDAC1 and HDAC3 induces a marked depletion of S-phase cells and increase in the levels of G2/M cells in PC-3 cell cycle arrest. (A) The cell cycle distribution of PC-3 cells treated for 24 h with increasing concentrations of SAHA (0 to 5 μM) was analyzed by propidium iodide (PI) staining by flow cytometry. The percentages of cells in the G0/G1, S, and G2/M phases were evaluated by measuring DNA content. Data represent means ± SD of results from three independent experiments. (B and C) PC-3 cells, pretreated as described for panel A, were subsequently infected with VSVΔM51-GFP (MOI of 10−2). Infectivity was quantified at 24 h postinfection (p.i.) by flow cytometry. (B) Cell death was assessed using annexin V (AnnV)/7AAD staining by flow cytometry. (C) Data represent means ± SD of results from three experiments. (D) PC-3 cells treated with SAHA (5 μM) for 24 h (T0), as well as PC-3 cells pretreated with SAHA and then infected with VSVΔM51-GFP (MOI of 10−2) for a subsequent 24 h, were analyzed for CDKN1A gene expression by qPCR. Gene expression levels were calculated using the threshold cycle (ΔΔCT) method. Data represent means ± SD of results from three independent experiments. The same samples were used to obtain total cell extracts and analyzed by immunoblotting for p21 protein levels. β-Actin was used as a loading control. Results are from a representative experiment. F.I., fold increase. (E to G) PC-3 cells were treated with SAHA (5 μM), RESM (5 μM), TBSA (10 μM), or MS-275 (10 μM) for 24 h (T0) or were left untreated (DMSO). (E) The cell cycle distribution was analyzed by PI staining by using flow cytometer. (F) CDKN1A, CDK6, and CCDN1 gene expression levels were evaluated by qPCR analysis. The gene expression levels were calculated using the ΔΔCT method. Data are representative of results from three independent experiments. (G) Total cell extracts were analyzed by immunoblotting for p21, p16INK4A, IκB α, SQSTM1, and LC3B. GAPDH was used as a loading control. Acetyl-α-tubulin and acetyl-histone H3 were used as controls for analysis of the specific activity of the different HDAC inhibitors. Results are from a representative experiment.

