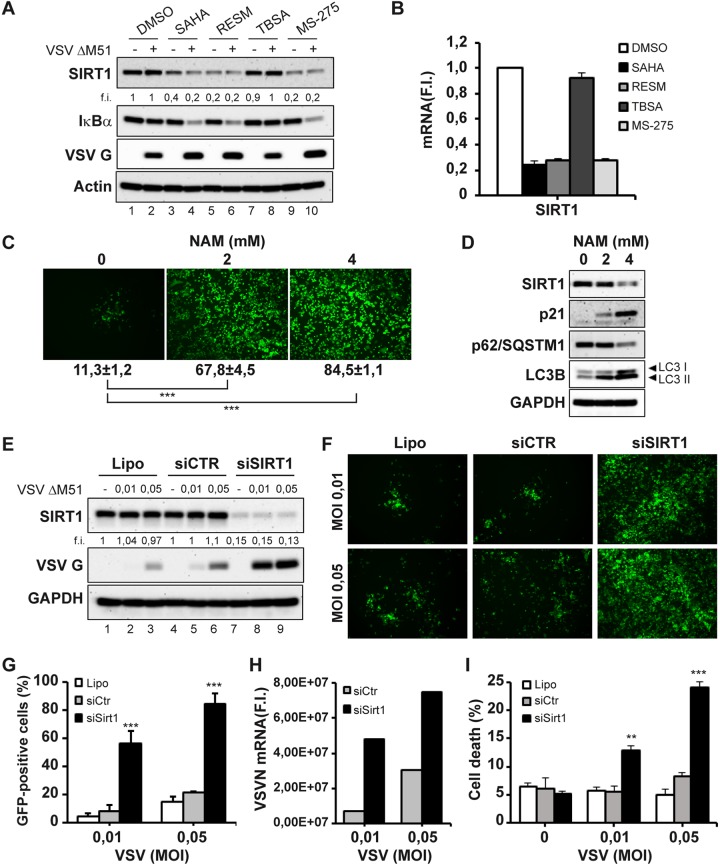
FIG 3.
Inhibition of SIRT1 expression enhances VSVΔM51 infectivity and cell death in PC-3 cells. (A and B) PC-3 cells were treated with SAHA (5 μM), RESM (5 μM), TBSA (10 μM), or MS-275 (10 μM) for 24 h or were left untreated (DMSO) and were subsequently infected with VSVΔM51-GFP (MOI of 10−2) for 24 h. (A) Total cell extracts were analyzed by immunoblotting for SIRT1, IκB α, and VSV G. β-Actin was used as a loading control. Results are from a representative experiment. (B) Analysis of Sirt1 gene expression by qPCR. Gene expression level was calculated using the ΔΔCT method. Data represent means ± SD of results from three independent experiments. (C and D) PC-3 cells were treated with increasing concentrations of nicotinamide (NAM) for 24 h and subsequently infected with VSVΔM51-GFP (MOI of 10−2) for 24 h. (C) Infectivity was determined at 24 h p.i. by fluorescence microscopy or quantified by flow cytometry. (D) Total cell extracts were analyzed by immunoblotting for SIRT1, p21, p62/SQSTM1, and LC3B. GAPDH was used as a loading control. Results are from a representative experiment. (E to I) PC-3 cells were transfected with control (CTR) or Sirt1 siRNA and were infected 48 h later with VSVΔM51-GFP (MOI of 0.01 or 0.05). (E) Whole-cell extracts were analyzed by immunoblotting for SIRT1 and VSV G. GAPDH was used as a loading control. Results are from a representative experiment. Lipo, Lipofectamine; siCTR, small interfering control; siSIRT1, small interfering SIRT1. (F and G) Viral infectivity was determined at 24 h p.i. by fluorescence microscopy (F) and measured by flow cytometry (G). Data represent means ± SD of results from three independent experiments. (H) Viral RNA levels were measured by qPCR. (I) Cell death was assessed using 7-AAD staining by flow cytometry.

