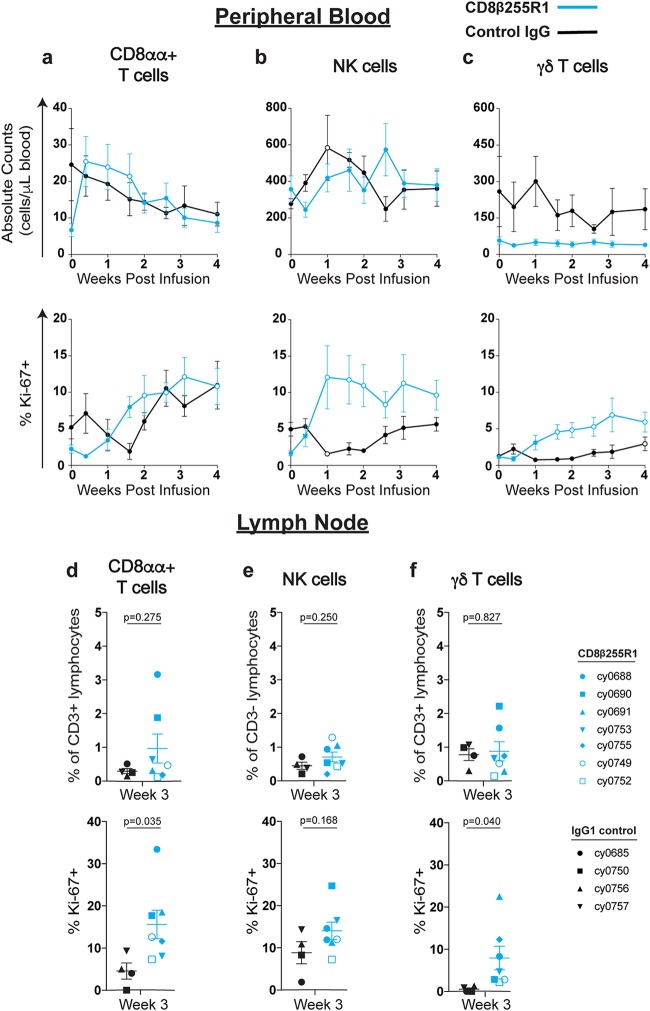
FIG 5.
Proliferation of CD8αα+, NK cells, and γδ T cells in peripheral blood following infusion with CD8β255R1. The absolute cell count and percent Ki-67+ of CD8α+ lymphocytes from peripheral blood and lymph nodes were measured by multicolor flow cytometry for 4 weeks after infusion with CD8β255R1 (blue) or control IgG (black). Within peripheral blood, individual time points represent mean ± SEM for animals, and open circles represent a significant change from baseline. Within the lymph nodes, individual animals are represented by a unique symbol. (a to c) Absolute count (top panels) and percent Ki-67+ (bottom panels) of CD8αα+ T cells (a), NK cells (b), and γδ T cells (c) in peripheral blood. (d) Percent CD8αα+ T cells of CD3+ lymphocytes (top) and percent Ki-67+ CD8αα+ T cells (bottom) in lymph nodes. (e) Percent NK cells of CD3− lymphocytes (top) and percent Ki-67+ NK cells (bottom) in lymph nodes. (f) Percent γδ T cells of CD3+ lymphocytes (top) and percent Ki-67+ γδ T cells (bottom) in lymph nodes. In peripheral blood, paired difference comparisons of changes from baseline in animals that received CD8β255R1 or control IgG were statistically significant (P < 0.05) at day 3, day 7, and day 18 for the absolute count of CD8αα+ T cells, at day 18 for the absolute count of γδ T cells, at day 7, day 10, and day 14 for the percentage of NK cells expressing Ki-67, and at day 22 for the percentage of γδ T cells expressing Ki-67.

