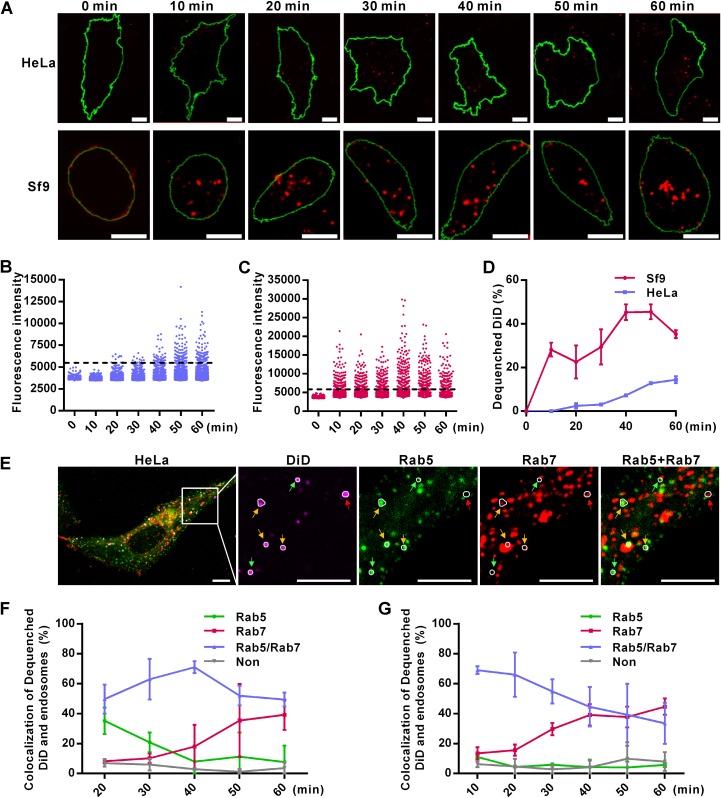
FIG 2.
Inefficient virus-endosome fusion restricts the entry of AcMNPV into mammalian cells. (A) Detection of virus-endosome fusion by DiD-dequenching methodology. HeLa and Sf9 cells were incubated with DiD-labeled virus (Ac-DiD; MOI of 200 TCID50 units/cell) at 4°C to allow virus binding, cultured at 37°C (HeLa cells) or 27°C (Sf9 cells) for indicated times, and imaged via fluorescence microscopy. Red dots indicate DiD fluorescence, and green lines outline the cells. Bars, 10 μm. (B and C) Changes in DiD fluorescence intensities in HeLa (B) and Sf9 (C) cells. Five randomly selected microscope fields from the experiment whose results are shown in panel A were analyzed at each time point. Dashed lines indicate the thresholds for defining dequenched DiD. (D) Percentages of dequenched DiD. Images from the experiment whose results are shown in panel A were analyzed for DiD intensity, and the percentages of dequenched DiD were calculated. The results are mean values ± SD (n = 2 independent experiments). (E) Colocalization of dequenched DiD and endosomes in HeLa cells at 20 min p.t. Cells transfected with plasmids expressing Rab5EGFP and Rab7mCherry were transduced by Ac-DiD (MOI of 200 TCID50 units/cell) and imaged. Dequenched DiD loci were determined and are indicated by white circles. Dequenched DiD colocalized with Rab5-, Rab7-, or Rab5+Rab7-marked endosomes is indicated by green, red, and yellow arrows, respectively. (F and G) Statistics of colocalization of dequenched DiD and endosomes in HeLa (F) and Sf9 (G) cells analyzed as described for panel E. “Non” represents dequenched DiD that was not located in Rab5- or Rab7-marked endosomes. More than 20 randomly selected cells were analyzed at each time point. The results are mean values ± SD (n = 2 independent experiments). Bars, 10 μm.

