FIG 5.
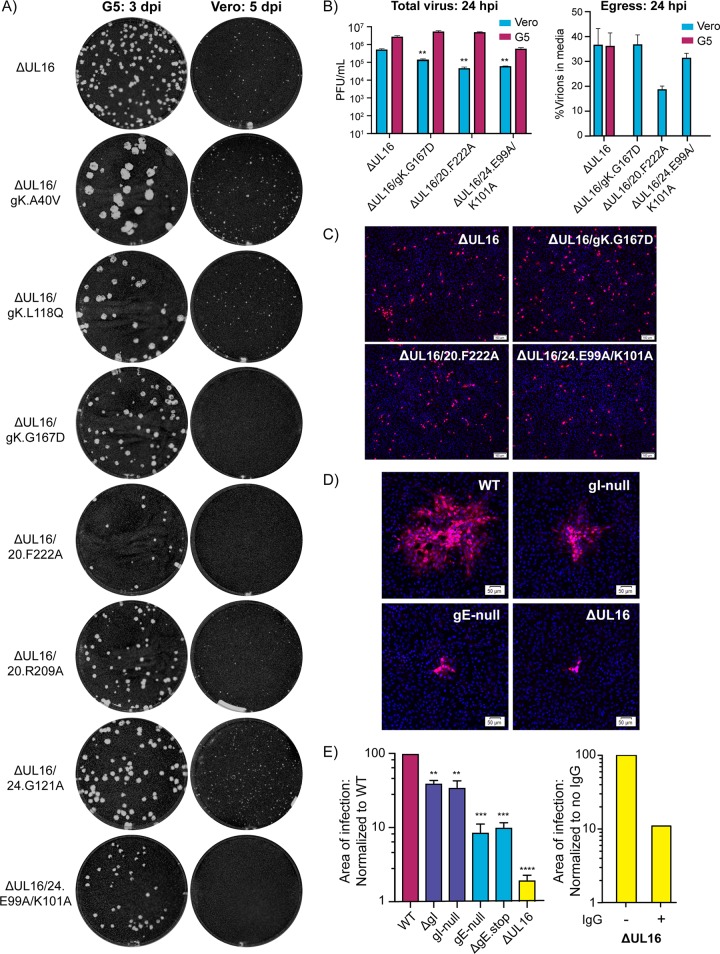
Unexpected spreading defects among ΔUL16/syn variants. (A) Plaque assays for each of the indicated mutant viruses were done on G5 (complementing) or Vero cells. The G5 plaque assays (left column) were fixed at 3 days postinfection (dpi), and the Vero plaque assays (right column) were fixed at 5 dpi. Plaques were visualized by staining with crystal violet. (B) Vero cells or G5 cells were infected with the indicated viruses at an MOI of 3. At 24 hpi, infected cell lysates and the media were harvested separately, and virus titers were measured with plaque assays on G5 cells. The left panel shows the average total virus titers obtained from two measurements for each mutant in each cell type. A Student's t test was used to analyze the reductions in titer of the ΔUL16/syn mutants compared to the ΔUL16 parent in Vero cells. **, P < 0.01. The right panel shows the percentage of infectious virions released into the medium when Vero or G5 cells were infected with the ΔUL16 parent. Release of the ΔUL16/syn variants is shown only for Vero cells because in G5 cells the syncytia that are produced are prone to bursting. (C) Noncomplementing Vero cells were infected at an MOI of 0.05 with the ΔUL16 parent or the three non-plaque-forming mutants, all of which had been produced in Vero cells. At 18 h postinfection, the cells were fixed and stained with DAPI and an antibody against VP5. (D) Vero cells were infected with WT, gE deletion, gI deletion, or ΔUL16 viruses at a low MOI and incubated in medium containing 5 mg/ml pooled human IgG to block cell-free virus spread. At 48 hpi, the cells were fixed and stained with DAPI and an antibody specific for VP5. Representative sites of infection are shown with scale bar set to 50 μm. (E) For each virus, the average area of infection in the presence of neutralizing antibody was measured. For comparisons with the wild type (left panel), 40 sites were averaged. For comparison of ΔUL16 with itself in the presence or absence of neutralizing antibody (right panel), 30 sites were averaged. A Student's t test was used to analyze the area size reductions. **, P < 0.01; ***, P < 0.001; ****, P < 0.0001.

