Figure 3.
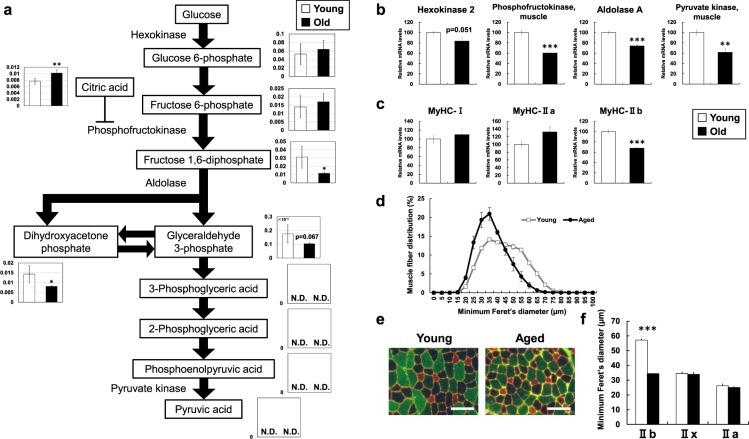
Metabolic changes related to glucose metabolism. (a) Metabolite changes in the skeletal muscle of young and aged mice are shown. Relative metabolite changes shown in the graphs were obtained by CE-TOFMS (Supplementary Table 1). Open bars, young mice; filled bars, aged mice. Data are expressed as mean ± SD (N = 5); **p < 0.01, *p < 0.05. Gene expression of (b) glucose metabolism and (c) myosin heavy chain in skeletal muscle from young and aged mice. Open bars, young mice; filled bars, aged mice. Data are expressed as mean ± SE (N = 5); ***p < 0.001, **p < 0.01. (d) Feret’s diameter of total fiber in tibilias anterior (TA) muscle. (e) Immunohistochemical analysis of the fiber-type composition in TA muscles. Red, type IIa and laminin; unstained, type IIx; green, type IIb. Scale bars 100 μm. (f) Myofiber Feret’s diameter of individual fiber types in TA muscle. ***p < 0.001. There were few type I fibers in all samples.

