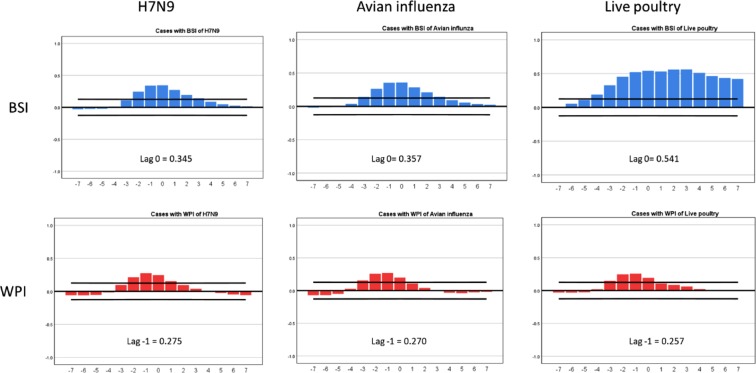
Figure 3.
Cross-correlation between H7N9 cases with BSI and WPI for searching and posting the H7N9, Avian influenza and Live poultry. Note: Blue bars indicate the value of BSI data from 2013–2017. The value of WPI data is displayed by red bars. Confidence intervals (95%) are indicated by the black line (X axis: lag value; Y axis: CCF value, defined as the set of sample correlations; highest value of lag and CCF are marked in each panel).

