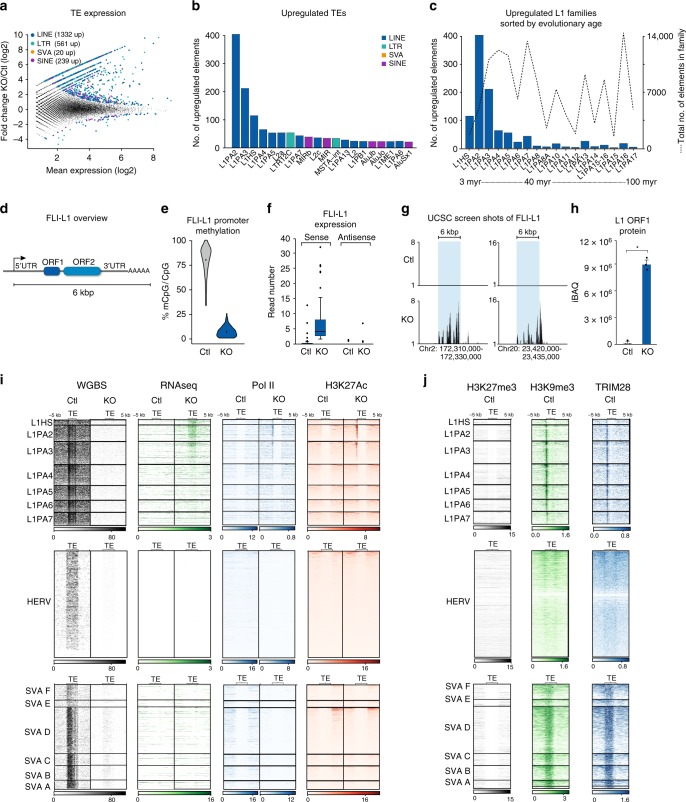
Fig. 2.
Primate-specific L1s are activated upon global demethylation in hNPCs and Pol II and H3K27Ac were deposited on L1 promotors. a The fold change of expression of all individual TEs in the human genome upon DNMT1-KO. Mean expression is taken from all samples of both conditions (n = 3 in both groups). Significance threshold at BH-corrected p < 0.05. b The number of upregulated elements per TE family in the DNMT1-KO (n = 3) vs control (n = 3). The top 20 families with the highest number of upregulated elements are shown. c The L1 families are arranged based on evolutionary age: the average number of upregulated elements in each family upon DNMT1-KO and the total number of elements in each family are plotted on the left and right y-axes, respectively (n = 3 in both groups). d A schematic overview of an FLI-L1. e Distribution of CpG methylation (mCpG/CpG) at FLI-L1s (n = 145). Each data point is the mean mCpG/CpG within an FLI-L1. The black dot shows the mean of all elements. f The expression of FLI-L1s in the sense and antisense directions shown as boxplots. The expression in the sense direction was significantly upregulated, p < 2.2e−16, two-sided Wilcoxon rank sum test. The boxplot elements represent: center line, median; box limits, upper and lower quartiles; whiskers, ×1.5 interquartile range; dots, outliers. g Screenshots from UCSC showing two examples of FLI-L1s (indicated by blue boxes) that are upregulated in the DNMT1-KO hNPCs. h The proteomic analysis detected L1 ORF1 protein in the DNMT1-KO hNPCs. Error bars represent SEM from n = 3 per group, p = 0.0019, student’s t-test. Source data is provided as a Source Data file. i Heatmaps of WGBS, RNA-seq, ChIP-seq of Pol II and H3K27ac in control and DNMT1-KO hNPCs in the eight youngest L1 subfamilies, all FL-HERVs, and all SVAs. WGBS data are shown as % mCpG at all CpG sites. RNA-seq is shown as sum of all three replicates at each base. ChIP-seq of Pol II and H3K27ac is shown as mean signal of both replicates at each base. j Heatmaps of ChIP-seq signals of TRIM28, H3K9me3, and H3K27me3 in hNPCs in the eight youngest L1s, FL-HERVs, and SVAs. ChIP-seq of TRIM28 and H3K9me3 is shown as log2ratio of IP vs input. ChIP-seq of H3K27me3 is shown as mean signal of two replicates at each base

