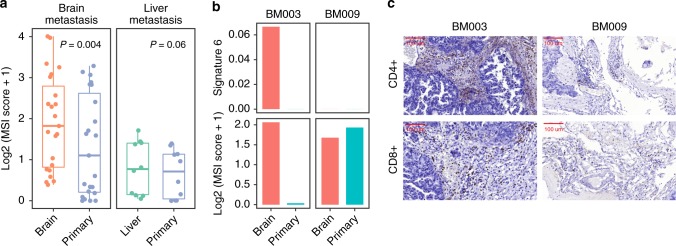
Fig. 3.
MSI statuses and tumor-infiltrating lymphocytes in brain metastases and matched primary tumors of CRC patients. a MSI scores were significantly higher in BM tissues than in primary tissues but were not elevated in liver metastatic tissues. The box plot displays the first and third quartiles (top and bottom of the boxes), median (band inside the boxes), and lowest and highest point within 1.5 times the interquartile range of the lower and higher quartile (whiskers). b, c Patient BM003 showed a consistent elevation of signature 6 mutations and the MSI score in BM tissues, whereas patient BM009 did not. In the brain tissues of patient BM003, there was a high degree of infiltration by CD4+ and CD8+ T cells

