
Figure 4.
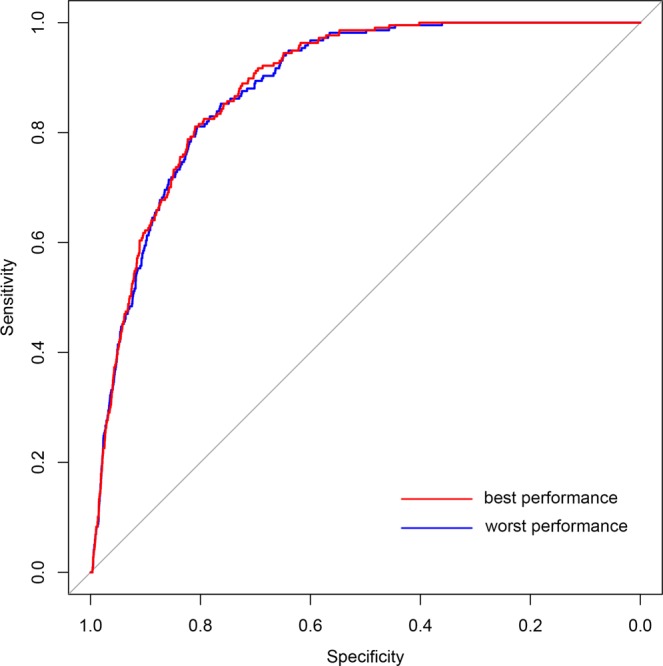
ROC curves of drug target predictions. Curve in red represents the best performance in ten rounds of predictions (AUC = 0.8849), while curve in blue represents the worst (AUC = 0.8820).
Official websites use .gov
A
.gov website belongs to an official
government organization in the United States.
Secure .gov websites use HTTPS
A lock (
) or https:// means you've safely
connected to the .gov website. Share sensitive
information only on official, secure websites.
ROC curves of drug target predictions. Curve in red represents the best performance in ten rounds of predictions (AUC = 0.8849), while curve in blue represents the worst (AUC = 0.8820).