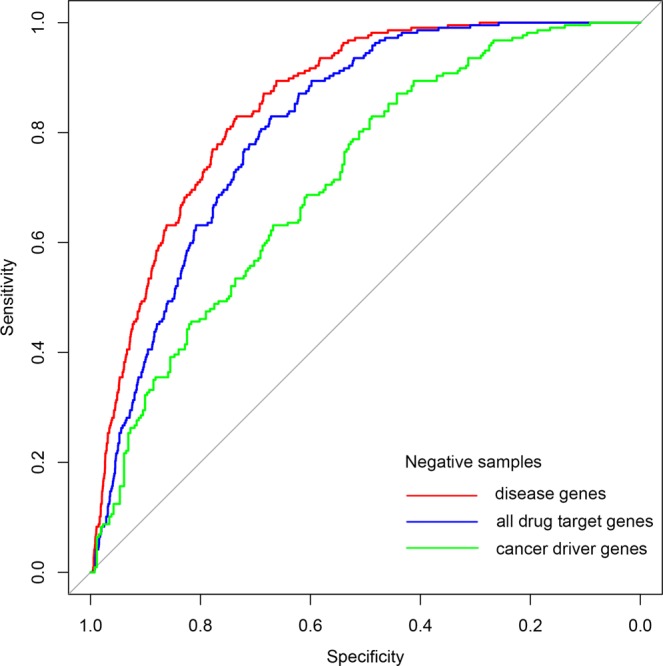
Figure 5.

ROC curves of combining the final prediction scores with different types of disease related genes as negative sample sets. Curve in red represents the performance using curated disease genes from DisGeNET database as negative samples (AUC = 0.8536). Curve in blue represents the performance using known human drug target genes from DrugBank database as negative samples (AUC = 0.8122). And curve in green represents the performance using cancer driver genes as negative samples (AUC = 0.7132).
