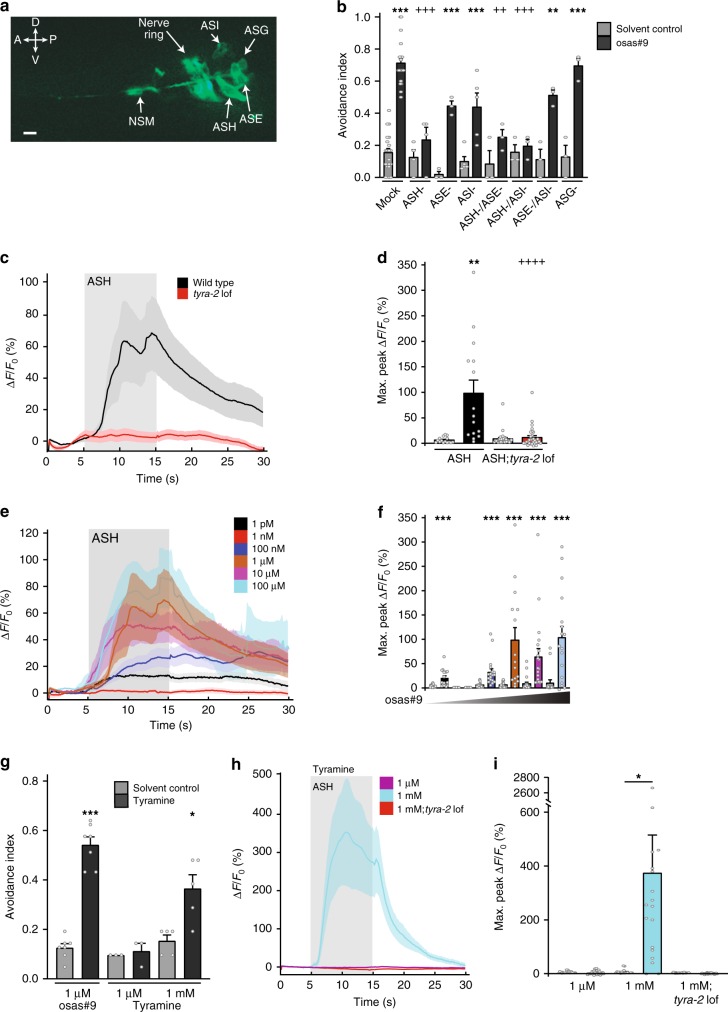
Fig. 3.
TYRA-2 is required in ASH for sensation of osas#9. a Cellular localization of TYRA-2 in sensory neurons. Expression is seen in ASE, ASG, ASH, ASH, and NSM neurons (×40 magnification, scale bar denotes 10 µm). b Chemosensory neurons required for osas#9 response. Neurons expressing tyra-2 reporter were ablated using laser microbeam. ASH ablations resulted in abolished response to osas#9 that was indistinguishable from solvent control. ASE and ASI ablated animals showed reduced but not complete loss of avoidance. n ≥ 3 trials (≥10 ablated animals precondition). c, d Calcium dynamics of ASH upon osas#9 exposure. c ASH::GCaMP3 animals (black) exhibit calcium transients when exposed to 1 µM osas#9. tyra-2 lof animals (red) did not display a change in fluorescence upon stimulation. Shaded region gray depicts time animals were subjected to osas#9, n = 10 animals. d Maximum fluorescence intensity before (solvent control, gray) and during exposure to 1 µM osas#9 of ASH::GCaMP3 animals (black) and tyra-2 lof animals (red). e osas#9 elicits calcium transients in ASH neurons at a broad range of concentrations: 1 pM (black), 1 nM (red), 100 nM (blue), 1 µM (orange), 10 µM (magenta), 100 µM (cyan), n ≥ 10 animals per condition. f Maximum fluorescence intensity before and during exposure to varying osas#9 concentrations. g Tyramine elicits avoidance only at high concentrations in wild-type animals, n ≥ 5 trials. h Calcium dynamics in ASH upon exposure to different concentrations of tyramine, for ASH::GCaMP3 1 µM (magenta) and 1 mM (cyan) and tyra-2 lof 1 mM tyramine (red). Tyramine exposure resulted in a significant increase in calcium transients in ASH at concentrations of 1 mM, but not 1 µM, n ≥ 10 animals. i Maximum fluorescence intensity before (solvent control) and during exposure to varying tyramine concentrations for ASH::GCaMP3 animals and tyra-2 lof animals. Data presented as mean ± S.E.M; *p < 0.05, **p < 0.01, ***p < 0.001. Figure 3b, one factor ANOVA with Sidak’s multiple comparison posttest. Figure 3d, f, i Student’s t-test was used to compare the solvent control to stimulus max peak fluorescence

