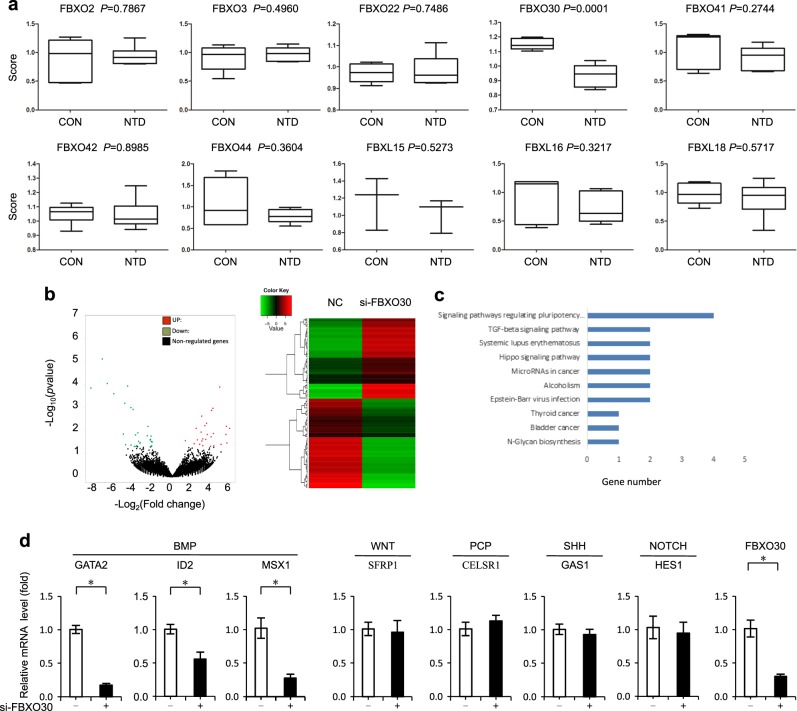
Fig. 1. FBXO30 expression is lowered in human NTDs tissues.
a iTRAQ ratio of F-box family for control and NTD brain tissue smaples: control samples (C2, C3, and C7); NTD samples (N5, N6, and N10). b SiRNA-NC vs. siRNA-FBXO30 in NT2/D1 cells. The total RNA was analyzed using RNA-seq. A total of DEGs showing differential expression were identified in the APN-treatment group (P < 0.05). c KEGG analysis of the DEGs in indicated groups. The −log10 p value of enrichment is shownon x-axis; the numbers represent the number of associated proteins for each term. d NT2/D1 cells were transfected with siRNA FBXO30. Expression of developmental pathway-related genes was analyzed by qPCR. All the above data are mean ± SD. (n = 3), *p < 0.05, by Student’s t test

