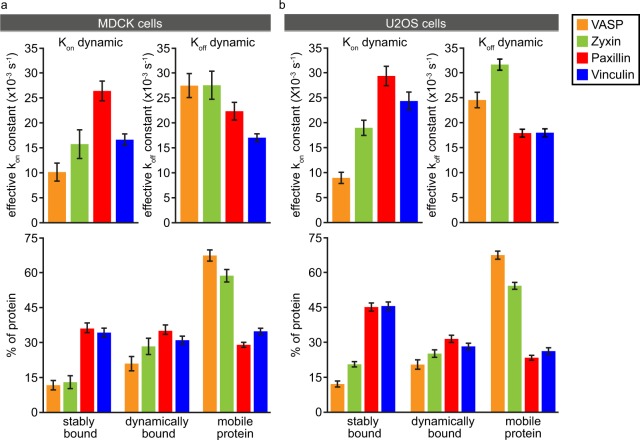
Figure 2.
Quantification of the FRAP data. (a) Parameters of FA protein dynamics in MDCK cells as determined by fitting the experimental curves shown in Fig. 1 to curves generated by Monte-Carlo based computer simulations. Bar charts of the on- and off-rate constants of the dynamically bound fractions (top panels) and the relative sizes of the stably bound, dynamically bound and mobile fractions (bottom panels). Error bars indicate 2xSEM. VASP n = 111[16], zyxin n = 81[15], paxillin n = 152[26], vinculin n = 219[44] bleached FAs from [cells]. (b) Parameters of FA protein dynamics in U2OS cells. VASP n = 233[34], zyxin n = 464[70], paxillin n = 332[40], vinculin = 249[37] bleached FAs from [cells].

