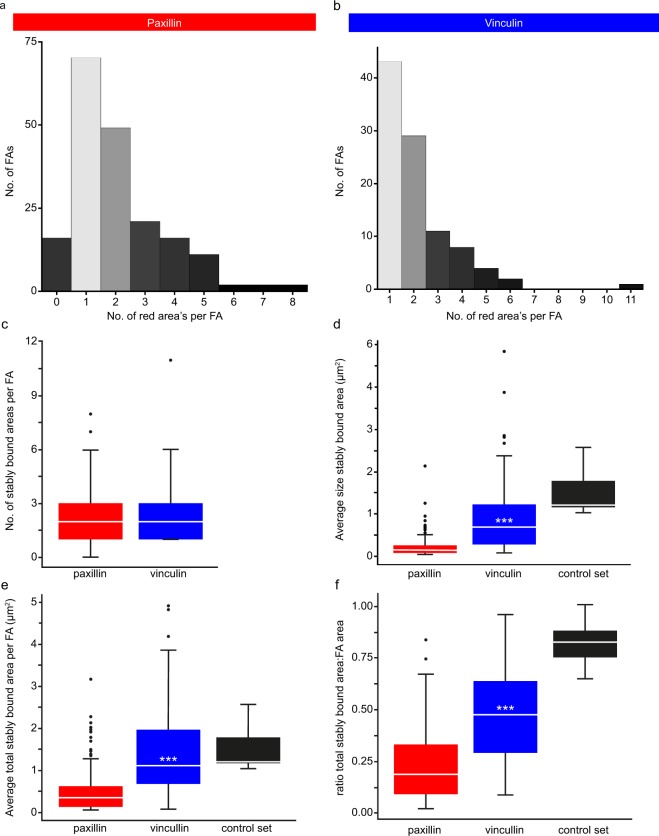
Figure 4.
Quantification of the photoconversion experiments. (a,b) Histograms of the number of stably bound areas (above threshold areas larger than 0.05µm2 after application of a dynamic threshold on the RV image) per FA for U2OS cells expressing paxillin-mMaple3 (a, n = 189 FAs in 153 cells) or vinculin-mMaple3 (b, n = 98 FAs in 84 cells). Note that for both proteins the largest number of FAs has one stably bound area. (c) Tukey style boxplots of the data shown in A. White lines: median; asterisks: significant p-values generated by two sided Mann Whitney tests: *p < 0.05, **p < 0.01, ***p < 0.001. (d) Tukey style boxplots of the surface area (µm2) of the individual stably bound areas for all FAs with stably bound areas (paxillin n = 173, vinculin n = 98, control n = 7). The control set contains cells expressing paxillin-mMaple3 which were chemically fixed prior to the photoconversion experiment. White lines and asterisks as in c. (e) Tukey style boxplots of the average total surface area (µm2) covered by stably bound areas per FA for all FAs (for n see d). White lines and asterisks as in c. (f) Tukey style boxplots of the ratio of the total area of the FA covered by stably bound area(s) over the total FA surface area (for n see d). White lines and asterisks as in c. Note that the proportion of the FA covered by stably bound area(s) is significantly larger for vinculin than paxillin, indicating that paxillin is more concentrated than vinculin since FRAP experiments have shown paxillin and vinculin have nearly identically sized stably bound fractions.

