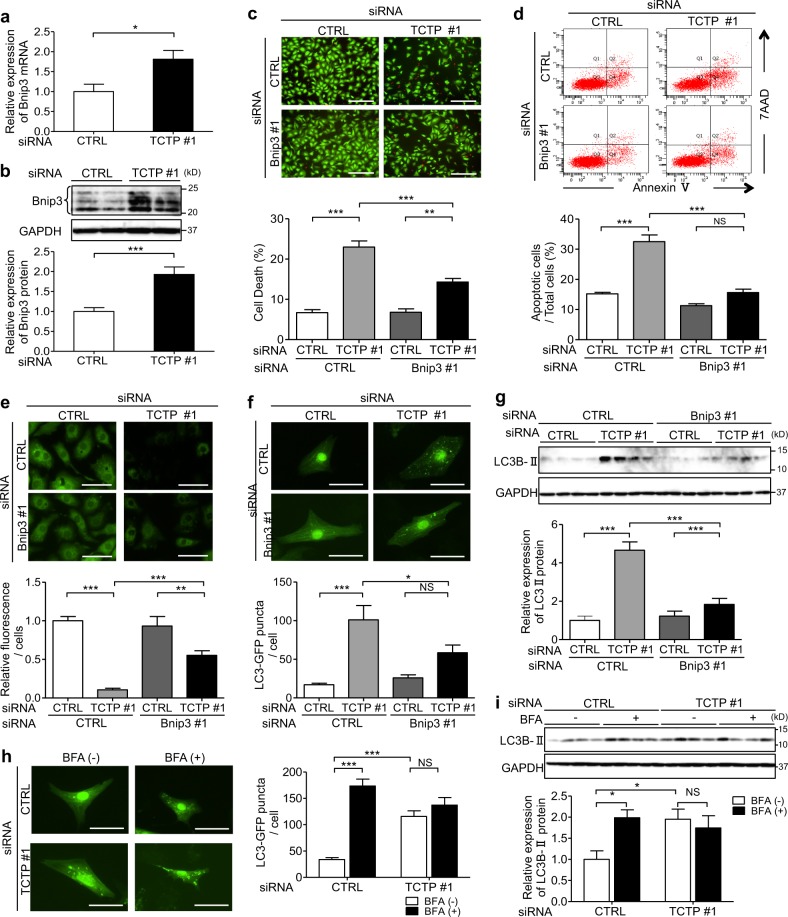
Fig. 3. TCTP downregulation caused cardiomyocyte death through a Bnip3-dependent mechanism.
a, b mRNA level (a) (n = 5–6) and protein expression (b) (n = 8) of Bnip3 in NRVMs transfected with non-targeting siRNA (CTRL siRNA) or siRNA targeting TCTP (TCTP siRNA #1) for 72 h. c–e NRVMs were transfected with non-targeting siRNA (CTRL siRNA) or siRNA targeting TCTP (TCTP siRNA #1), or Bnip3 (Bnip3 siRNA #1), or a mixture of both (TCTP siRNA #1 & Bnip3 siRNA #1). Cell death (c) (n = 4) and apoptosis (d) (n = 4–5) were determined by calcein-AM (green)/ethidium homodimer-1 (red) staining and flow cytometry after siRNA transfection for 72 h. Scale bar, 200 μm. e mPTP opening was assessed by co-loading with calcein/AM and CoCl2 after siRNA transfection for 24 h. Loss of green fluorescence is indicative of mPTP opening (n = 6). Scale bar, 40 μm. f NRVMs were infected with Ad-LC3-GFP (30 MOI) for 8 h and then transfected with non-targeting siRNA or siRNA targeting TCTP (TCTP siRNA #1), or Bnip3 (Bnip3 siRNA #1) or a mixture of both (TCTP siRNA #1 & Bnip3 siRNA #1) for 48 h. Green puncta indicate autophagosomes (n = 6). Scale bar, 25 μm. g Expression of LC3BII and GAPDH proteins in NRVMs transfection with siRNA for 72 h (n = 4). h NRVMs were infected with Ad-LC3-GFP (30 MOI) for 8 h and then transfected with non-targeting siRNA (CTRL siRNA) or siRNA targeting TCTP (TCTP siRNA #1) with or without BFA treatment for 6 h. Autophagosome formation was evaluated after 48 h. Green puncta indicate autophagosomes (n = 4). Scale bar, 25 μm. i Expression of LC3BII and GAPDH proteins in NRVMs transfection with siRNA for 72 h (n = 4). *P < 0.05, **P < 0.01, ***P < 0.001. Unpaired, two-tailed Student’s t-test (a, b) or One-way ANOVA followed by Tukey’s test (c–g) or two-way ANOVA followed by Bonferroni’s test (h, i)

