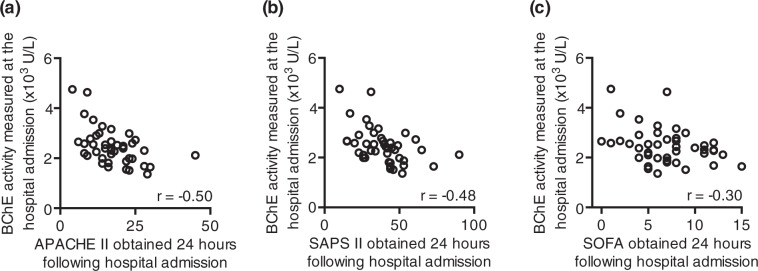
Figure 2.
The BChE activity measured upon arrival to the hospital correlates with the disease severity scores obtained 24 hours later. Scatter diagrams represent a correlation of the BChE activity, measured from major trauma patients at the hospital admission and the APACHE II (a), SAPS II (b) and SOFA (c) scores obtained 24 hours later. r – Spearman correlation coefficient; APACHE II - Acute Physiology And Chronic Health Evaluation II; SAPS II - Simplified Acute Physiology Score; SOFA - Sequential Organ Failure Assessment.

