Fig. 2.
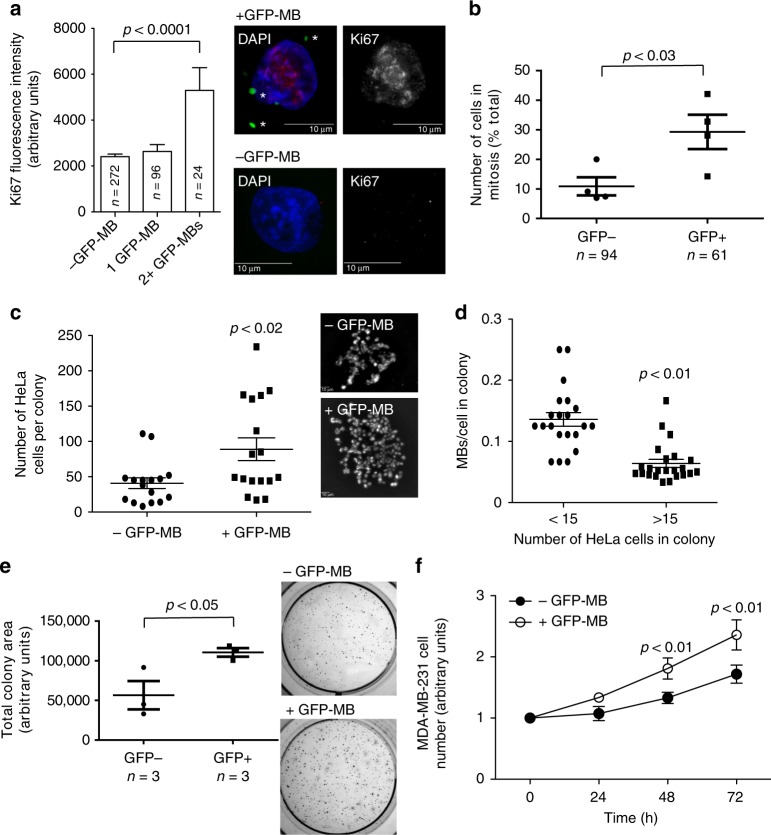
Post-abscission MB internalization stimulates cell proliferation. a, b HeLa cells were incubated with purified GFP-MBs for 3 h, followed by wash and incubation for another 24 h. Cells were then fixed and stained with anti-Ki67 (a) or anti-acetylated tubulin (b). Panel a shows quantification of Ki67 levels in each cell, while panel b shows quantification of the percentage of cells in mitosis (as determined by the presence of mitotic spindle). Data shown are the means and standard deviations derived from 200 randomly chosen cells from three independent experiments for Ki67 staining and four independent experiments for mitotic index quantification (Student’s unpaired, two-tailed t-test). Asterisks in images (a) mark post-abscission MBs. n shows the number of cells analyzed for each condition. c Hela cells stably expressing mCherry-CAAX were fed MBs and GFP-MB+ cells were identified by fluorescence microscopy. Unfed cells were used as a control. Cells were tracked using glass bottom dishes and were then tested for their proliferative capacity by imaging the same cell 7 days post feeding. Data shown are the means and standard deviations derived from four independent experiments (Student’s unpaired, two-tailed t-test). d HeLa cells were plated at low density and grown for 72 h to form colonies. Cells were then incubated for 3 h with purified GFP-MBs. The ability to internalize MBs by fast dividing cells (formed large colonies) was then compared to slow dividing cells (formed small colonies). Data shown are the means and standard deviations derived from three independent experiments (Student’s unpaired, two-tailed t-test). e Hela cells with internalized GFP-MBs were isolated by flow sorting. Cells were then tested for their ability to grow in soft agar. Data shown are the means and standard deviations derived from three independent experiments (Student’s unpaired, two-tailed t-test). f MDA-MB-231 cells with internalized GFP-MBs were isolated by flow sorting. Cells were then tested for their proliferative capacity. Data shown are the means and standard deviations derived from three independent experiments (Student’s unpaired, two-tailed t-test)

