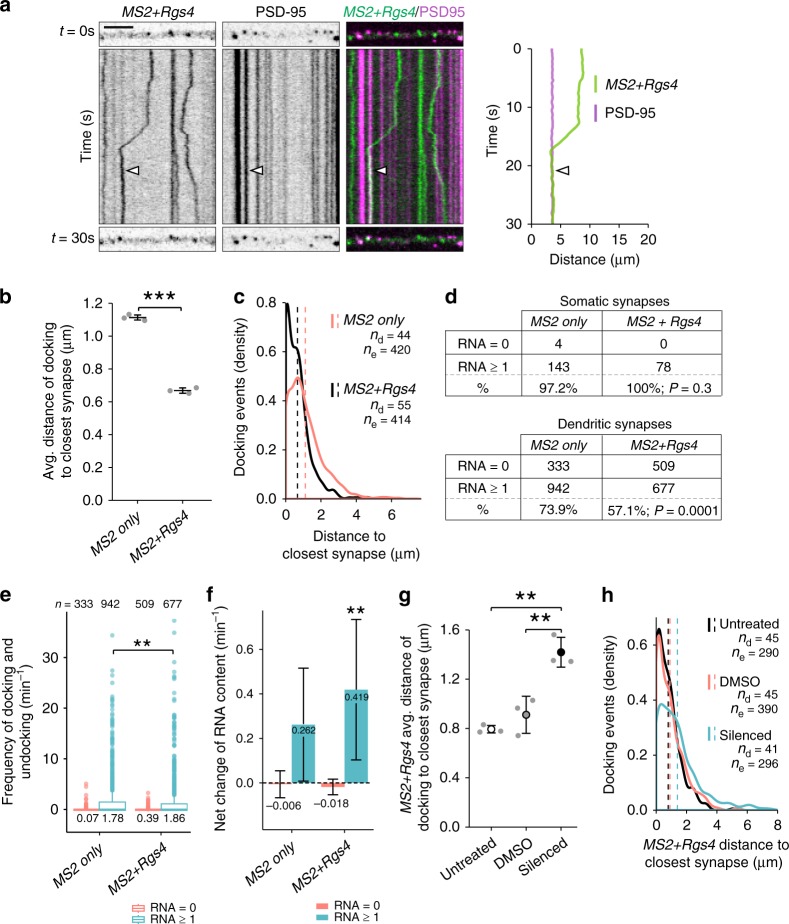
Fig. 4.
Rgs4 3′-UTR mediates mRNA recruitment to synapses dependent on neuronal activity. a Representative dual-color kymograph showing MS2+Rgs4 3′-UTR reporter mRNA (green) and PSD-95-tagRFPt (magenta) from a dendrite of a rat hippocampal neuron. First and last frames are shown at top and bottom. Scale bar 5 µm. Extracted track (right) of an mRNA granule docking at a PSD-95 positive area indicated by arrowheads. Distance of MS2 only or MS2+Rgs4 3′-UTR reporter mRNA docking events to closest PSD-95 positive cluster in neurons displayed as dot plot (b) and density plot (c). d Distribution of MS2 only or MS2+Rgs4 reporter mRNA-positive (estimated RNA number ≥1 at t = 0 s) and -negative (RNA = 0 at t = 0 s) PSD-95-tagRFPt clusters in soma and dendrites. P-values of Chi2 tests against control are indicated. e Integrated frequency of reporter docking and undocking events at dendritic synapses. Number of observations and population means are indicated. f Average net change of MS2 only or MS2+Rgs4 mRNA content at mRNA reporter-positive or -negative synapses per min, calculated from estimated reporter molecules docking or undocking at synapses per event. Numbers indicate mean value of net RNA level change. Error bars represent 95% confidence intervals. ** indicates significant (α = 0.01) difference compared to zero (null hypothesis, two sided one-sample t-test). Distance of MS2+Rgs4 3′-UTR reporter mRNA docking events to closest PSD-95 positive cluster under untreated, vehicle treated (DMSO) or silenced (100 µM CNQX, 50 µM AP5, 1 µM TTX) conditions displayed as dot plot (g) and density plot (h). Data represent mean ± standard deviation of three independent experiments (individual experiments shown as gray dots; b, g). Dashed lines represent mean values of single data points (c, h). Asterisks represent p-values obtained by Student’s t test (b), Mann Whitney U test (e) or Tukey’s test post-hoc to one-way ANOVA analysis (g) (**p < 0.01, ***p < 0.001). Data were obtained from 40-µm dendritic segments at a minimal distance of 20 µm from the cell body. At least 10 dendrites/condition/experiment (a–c, g, h) or 12 neurons/condition (d–f) from 3 independent biological replicates were analyzed. Total number of dendrites (nd), events (ne) and synapses (n) analyzed per condition are indicated

