Fig. 1.
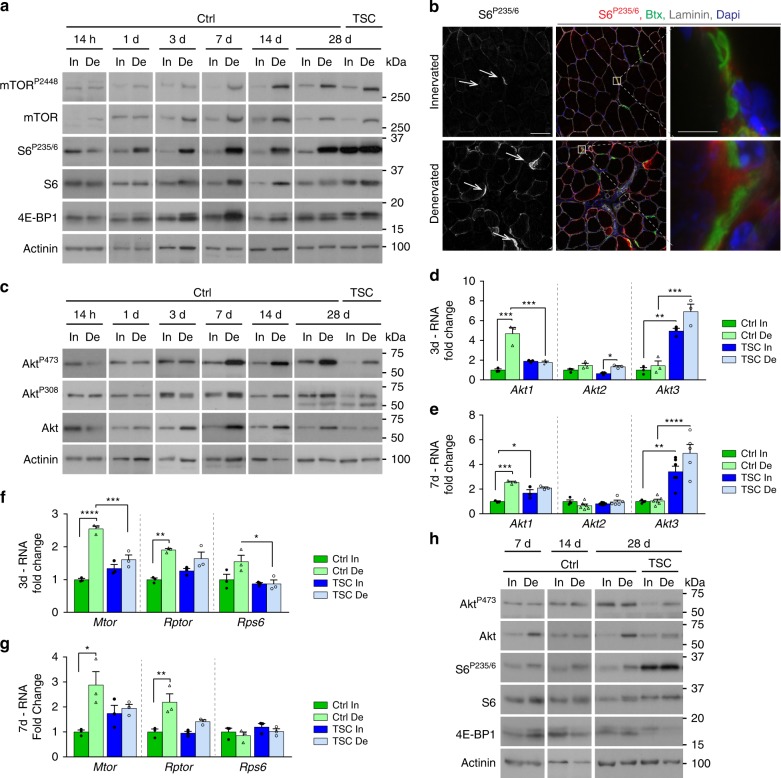
The PKB/Akt-mTORC1 branch is induced upon denervation in TA muscle. a Western blot analysis of mTORC1 signaling in control (Ctrl) and TSCmKO (TSC) TA innervated (In) and denervated (De) muscles. Actinin was used as loading control. Representative image of 4 (14 h, 1d) and 3 (3 to 28d) Ctrl and 3 TSCmKO mice. b Confocal images of S6P235/6 (red), laminin (gray), α-bungarotoxin (green) and Dapi (blue) in TA innervated and denervated muscles (four independent assays). The white arrows point to endplates. Scale bar, 50 µm (5 µm for enlarged view). c Western blot analysis of total and phosphorylated PKB/Akt in control and TSCmKO TA innervated and denervated muscles. Actinin was used as loading control. Representative image of 4 (14 h to 3d) and 3 (14 and 28d) Ctrl and 3 TSCmKO mice. d–g mRNA levels of Akt1, Akt2 and Akt3 (d, e) and Mtor, Rptor and Rps6 (f, g) in TA innervated muscle and after 3 (d, f) and 7 (e, g) days of denervation, in TSCmKO and control mice. Levels are relative to Tbp mRNA and to Ctrl innervated muscle. Values are mean ± s.e.m.; n = 4–6 (Akt2/Akt3) and 3 (all other genes) mice per genotype; *p < 0.05, **p < 0.01, ***p < 0.001, ****p < 0.0001, two-way ANOVA with a Tukey’s post-hoc analysis. h Western blot analysis of PKB/Akt and mTORC1 pathways in soleus control and TSCmKO muscles after 7, 14, and 28 days of denervation (n = 3 per group). Western blot quantifications are shown in Supplementary Table 1. Source Data are provided in the Source Data File

