Fig. 3.
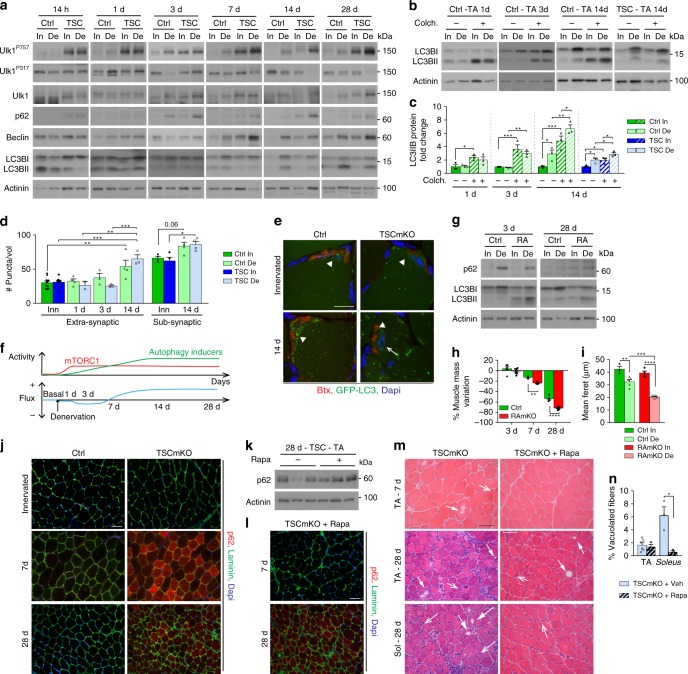
mTORC1 deregulation impairs autophagy dynamics upon denervation. a–c Western blot analysis of autophagic markers in TA control (Ctrl) and TSCmKO (TSC) muscles after 14 h, 1, 3, 7, 14 and 28 days of denervation (a, representative of 4 (14h-7d) and 3 (14 and 28d) Ctrl and 3 TSCmKO mice per time point), and after 1, 3 and 14 days of denervation coupled with colchicine (colch.) treatment (b). Quantification of LC3BII levels in (b) is given in (c); n = 3. d, Quantification of GFP-LC3-positive vesicles in TA control and TSCmKO innervated (In) muscles, and after 1, 3 and 14 days of denervation (De), in extra- and sub-synaptic regions. A volume unit (Vol) is 3.2 × 103 µm3. n = 11, 4, 3, 4 Ctrl and 8, 2, 3, 3 TSCmKO (In, 1, 3 and 14d). e Fluorescent images (three independent assays) of TA control and TSCmKO innervated and denervated (14d) muscles showing GFP-LC3-positive puncta (green), α-bungarotoxin (Btx, red) and Dapi (blue). Arrowheads point to endplate region; the arrow indicates a swollen myonucleus. Scale bar, 30 µm. f Scheme illustrating changes in mTORC1 activity and autophagic flux in TA muscle upon denervation. g Western blot analysis of autophagy markers in innervated TA control and RAmKO (RA) muscles and after 3 and 28 days of denervation. n = 3 Ctrl; 4 and 3 RAmKO (3 and 28d) mice. h Mass variation for TA muscle from control and RAmKO mice after 3, 7 and 28 days of denervation. n = 6, 3 and 5 Ctrl, 8, 4 and 6 RAmKO mice at 3, 7 and 28d. i Minimum mean fiber feret in TA innervated and denervated (28d) muscles from control and RAmKO mice. n = 3/4 (In) and 5 (De) Ctrl/RAmKO mice. j Fluorescent images of p62 (red) and laminin (green) for innervated and denervated TA muscles from control and TSCmKO mice. Representative of 3 Ctrl; 4 and 3 TSCmKO mice at 7 and 28 days. Scale bar, 50 µm. k Western blot analysis of p62 in TA denervated (28d) muscles from untreated (−) and rapamycin-treated ( + ) TSCmKO mice. Representative of 3 muscles per group. l p62 fluorescent images of TA muscle from rapamycin (Rapa)-treated TSCmKO mice after 7 and 28 days of denervation; 3 independent muscles per group. Scale bar, 50 µm. Compare (l) with untreated TSCmKO mice (j). m, n HE staining of TA and soleus muscles from untreated and rapamycin-treated TSCmKO mice, after 7 and 28 days of denervation (3 independent muscles per group). Open arrows and arrows point to abnormal nuclei and vacuoles, respectively. Scale bar, 50 µm. Quantification in (n) gives the proportion of vacuolated fibers at 28 days in TA and soleus muscles. n = 6 (untreated TA) and 3 (treated TA; soleus). Western blot quantifications are shown in Supplementary Table 1. Values are mean ± s.e.m; two-way ANOVA with Fisher’s (a) or Turkey’s (d, i) post-hoc tests, or two-tailed unpaired Student’s t-test (h, n), *p < 0.05, **p < 0.01, ***p < 0.001, ****p < 0.0001. Source Data are provided in the Source Data File

