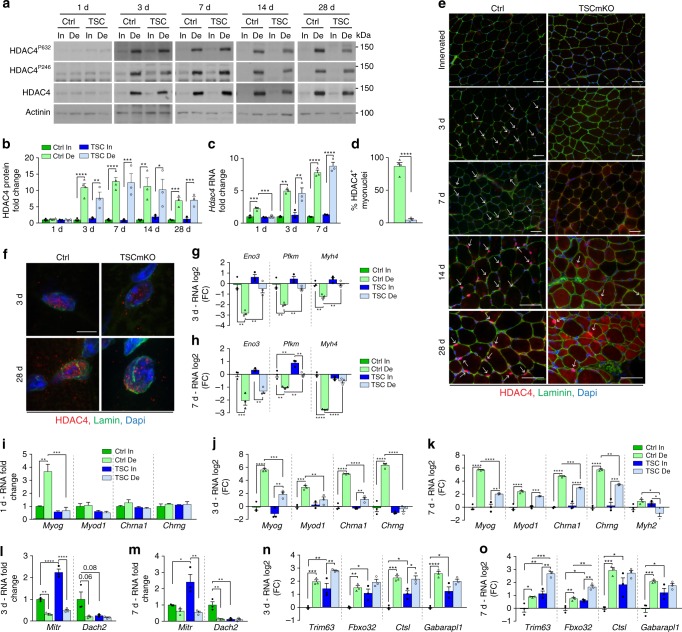
Fig. 5.
Sustained mTORC1 activation hampers HDAC4 signaling upon denervation. a, b Western blot analysis of total and phosphorylated HDAC4 in TA control (Ctrl) and TSCmKO (TSC) muscles after 1, 3, 7, 14 and 28 days of denervation (De). Quantification of HDAC4 protein levels is given in b; n = 4 (1, 3, 7d) and 3 (14, 28d) Ctrl, 3 TSCmKO mice. c Transcript levels of Hdac4 in TA innervated (In) muscle from control and TSCmKO mice, and after 1, 3, and 7 days of denervation. n = 3 per group. d, e Proportion of HDAC4-positive myonuclei in 3-day-denervated control and TSCmKO muscles (d), and the corresponding immunostaining showing HDAC4 (red) and laminin (green) in innervated muscle and after 3 to 28 days of denervation (e). Representative of 3–4 independent muscles per genotype. Arrows point to HDAC4-positive myonuclei. Scale bar, 50 µm. d, n = 3 per group. f Confocal pictures of endogenous HDAC4 (red) and lamin (green) in myonuclei from control and TSCmKO muscles after 3 and 28 days of denervation (from 4 (3d) and 3 (28d) independent muscles). Scale bar, 5 µm. 3D reconstruction is given in Supplementary Fig. 5a. g–o mRNA levels of HDAC4 targets Eno, Pfkm and Myh4 (g, h) of MyoG, Chrna1, Chrng, Myod1 and/or Myh2 (i–k), of the corepressors Mitr and Dach2 (l, m), and of Trim63, Fbxo32, Ctsl and Gabarapl1 (n, o) in TA innervated muscle and after 1 (i), 3 (g, j, l, n) and 7 (h, k, m, o) days of denervation in TSCmKO and control mice. Transcript levels are relative to Tbp mRNA and to Ctrl innervated muscle and, analyzed as the log2 fold change (FC) for (g, h, j, k, n, o). n = 3 per group. All values are mean ± s.e.m.; two-way ANOVA with Fisher’s (b) or Tukey’s (c, g–o) post-hoc tests, or two-tailed unpaired Student’s t-test (d), *p < 0.05, **p < 0.01, ***p < 0.001, ****p < 0.0001. Western blot quantifications are shown in Supplementary Table 1. Source Data are provided in the Source Data File

