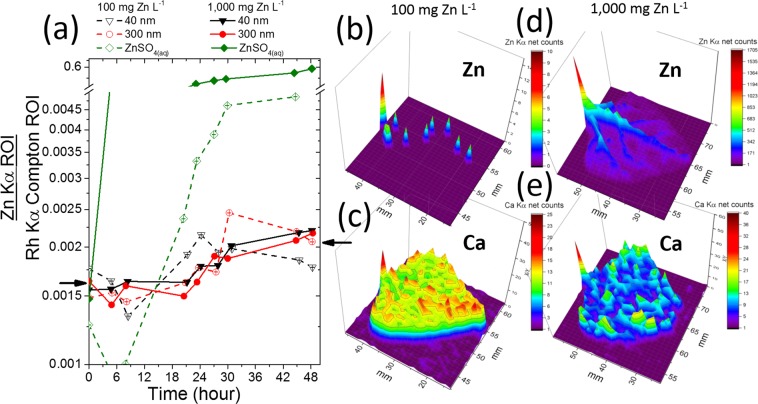
Figure 4.
(a) Content of Zn in the petiole as function of time for plants exposed to 100 and 1000 mg of Zn L−1 of ZnSO4(aq), 40 nm and 300 nm ZnO. The Zn counts at the time corresponding to zero hour were recorded immediately before the plants were exposed to the treatments; (b,c) spatial distribution of Zn and Ca, respectively, in the leaf whose plant was exposed to 100 mg Zn L−1 of ZnSO4(aq), (d,e) spatial distribution of Zn and Ca, respectively, in the leaf whose plant was exposed to 1000 mg Zn L−1 of ZnSO4(aq). The chosen leaflet was the central one in the first trefoil that was the petiole monitored by the XRF.

