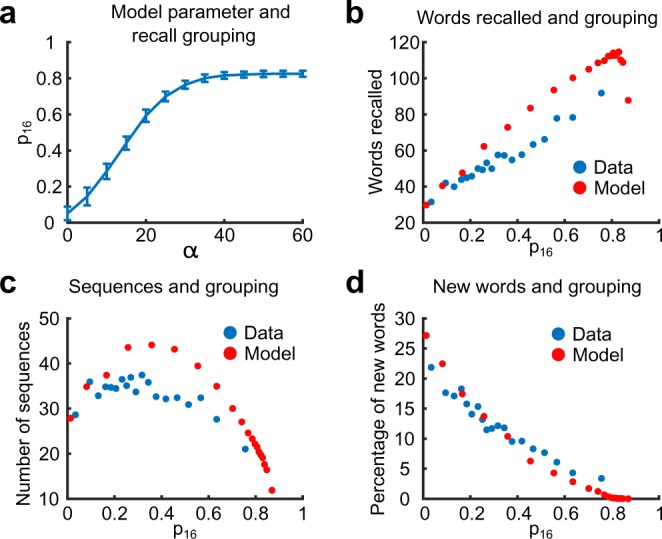
Figure 5.

Hierarchical model results. (a) Value of the induced p16 in the model simulations as a function of α. Blue line is the average of the value of p16 with a confidence interval of 95%. (b) Scatter plot of the performance as a function of p16 both data and model. For each session the number of words retrieved in FFR is shown against the p16 score. (c) Scatter plot for the number of sequences retrieved as a function of p16 for each session both data and model. (d) Scatter plot for the percentage of words not retrieved in the IFR but recalled in the FFR as a function of p16 for each session both data and model.
