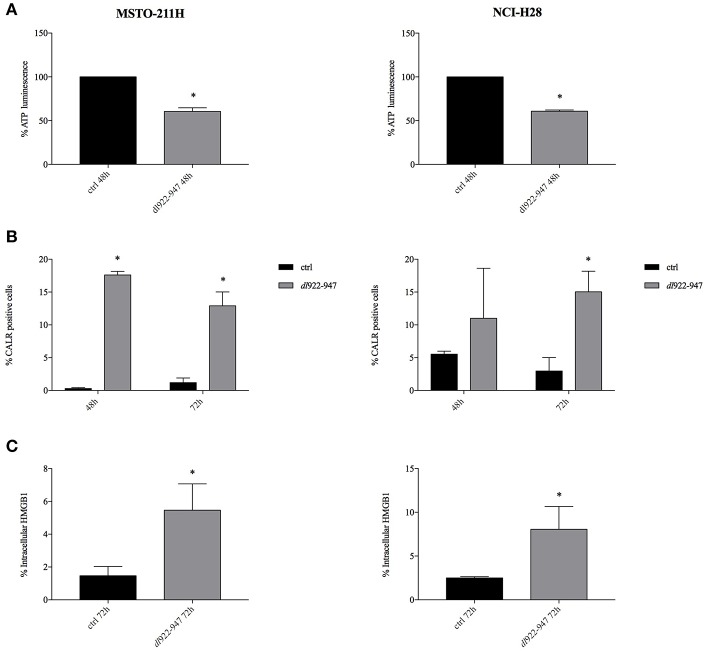
Figure 4.
dl922-947 infection induces ICD in MPM cell lines. Intracellular ATP content (A), calreticulin cell surface exposure (B), and HMGB1 secretion (C) evaluated in MSTO-211H and NCI-H28 cells infected with dl922-947 at its IC50 values with respect to the control cells (black bar). In (A) the histograms report the luminescence percentage indicative of ATP content at 48 hpi. In (B) the histograms report the percentage of calreticulin positive MPM cells at 48 and 72 hpi (the mean fluorescence intensity, MFI is reported in Supplemental Table 1). In (C) the histograms report the percentage of HMGB1 positive cells at 72 hpi (MFI is reported in Supplemental Table 2). The histograms show the mean ± s.d. of three independent experiments. The statistical analysis was performed by t-test (*p < 0.05).

