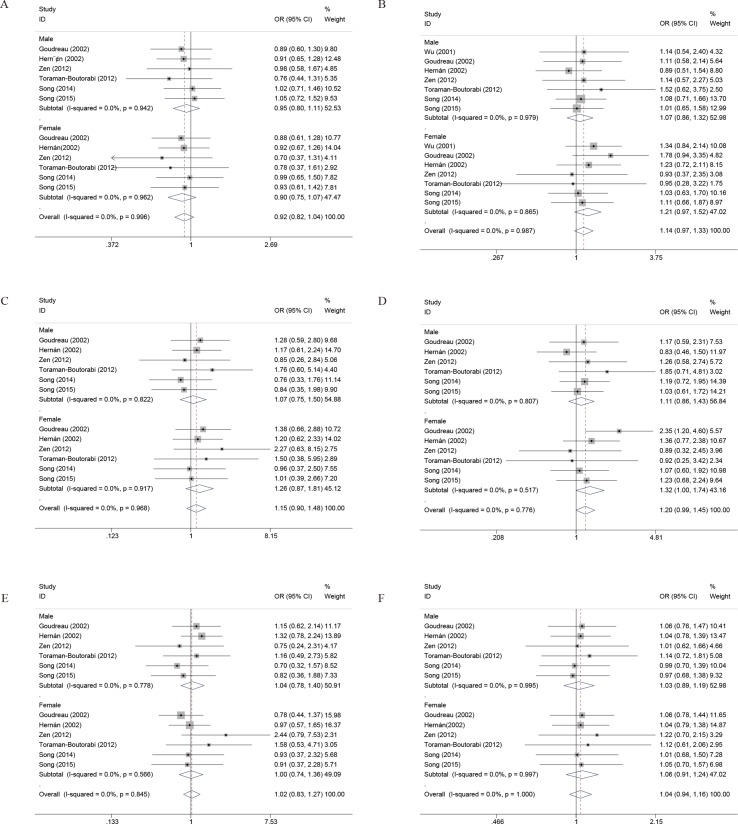
Figure 3.
Forest plots for the association between COMT Val158/108Met polymorphism and PD risk-stratified by gender. (A) Addictive genetic model (A vs G). (B) Dominant genetic model (AA +GA vs GG). (C) Homozygous model (AA vs GG). (D) Heterozygous model (GA vs. GG). (E) Recessive genetic model (AA vs. GG + GA). (F) Allelic genetic model (A allele distribution frequency of COMT Val158Met gene polymorphism).

