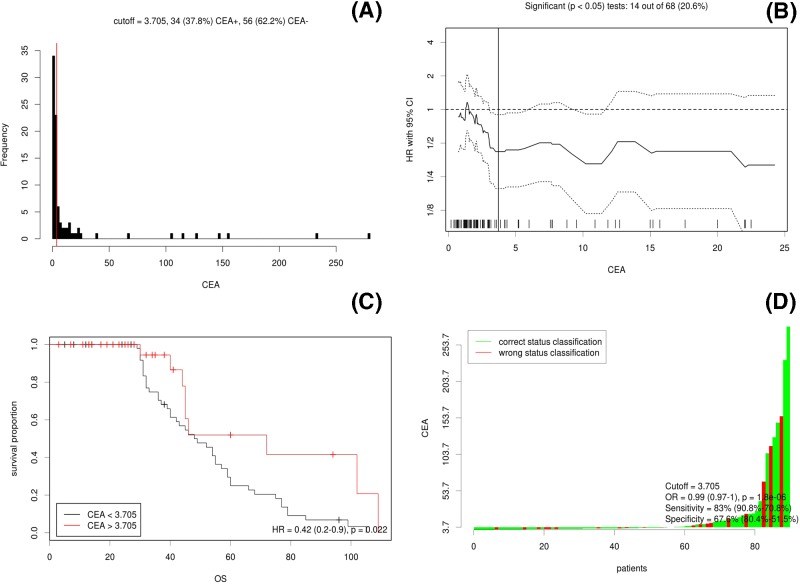
Figure 1. Cut-off optimization by correlation with survival detailed in the CRC data.
(A) Histograms of primary CEA levels in 90 CRC cases. Vertical line (red line) is the optimal cut-off derived from the survival-based model. (B) The hazard ratio including 95% CI is plotted in dependence of the cut-off. A vertical line designates the dichotomization showing the most significant correlation with OS. The distribution of CEA levels in the 90 tumors is shown as a rug plot at the bottom of the figures. (C) Different survival according to CEA levels; (D) the odds ratio including 95% CI is plotted in dependence of the cut-off. A vertical line designates the dichotomization showing the most significant correlation with OS.

