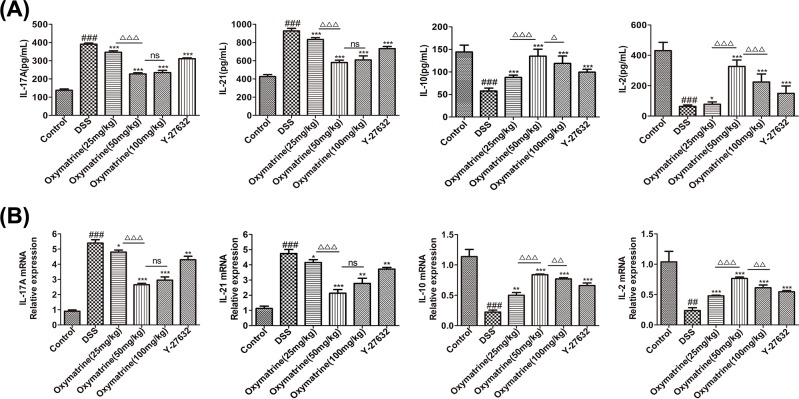
Figure 10. Effect of OMT on the levels of cytokine related to Th17 and Treg cells.
(A) ELISA analysis of IL-17A, IL-21, IL-10 and IL-2 in colon. Values represent means ± S.D. (n=8). (B) The mRNA expression levels of IL-17A, IL-21, IL-10 and IL-2 in colon were quantified. Values represent means ± S.D. (n=3). ###P<0.001, vs control group. *P<0.05, **P<0.01, ***P<0.001, vs DSS group. ΔΔP<0.01, ΔΔΔP<0.001 vs medium-dose oxymatrine group.

