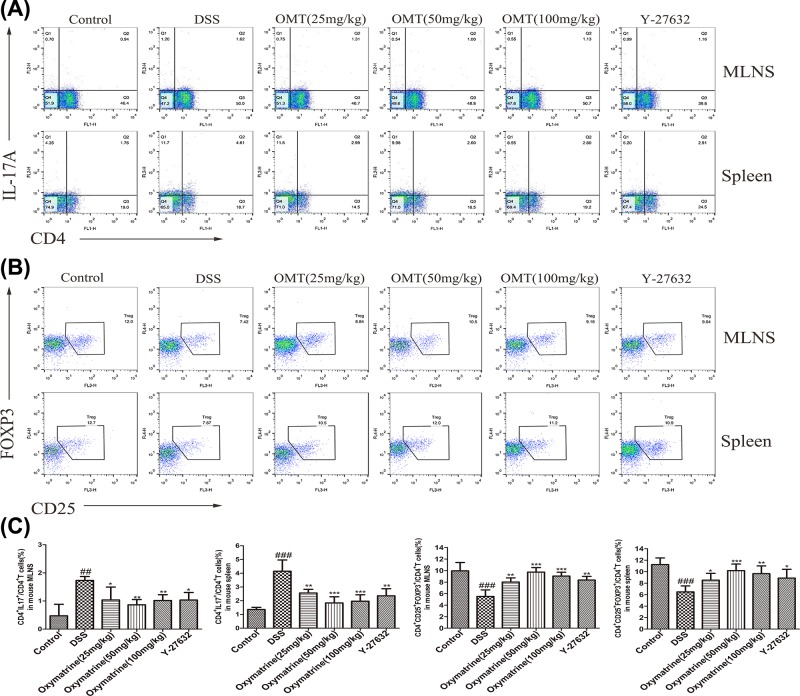
Figure 9. Effect of OMT on the differentiation of Th17 and Treg cells.
(A) and (B) The differentiation of Th17 and Treg cells in MLNs and spleen of mice was analyzed by flow cytometry. (C) The average percentage of Th17 and Treg cells in MLNs and spleen. Values represent means ± S.D. (n≥3). ##P<0.01, ###P<0.001, vs control group. *P<0.05, **P<0.01, ***P<0.001, vs DSS group.

