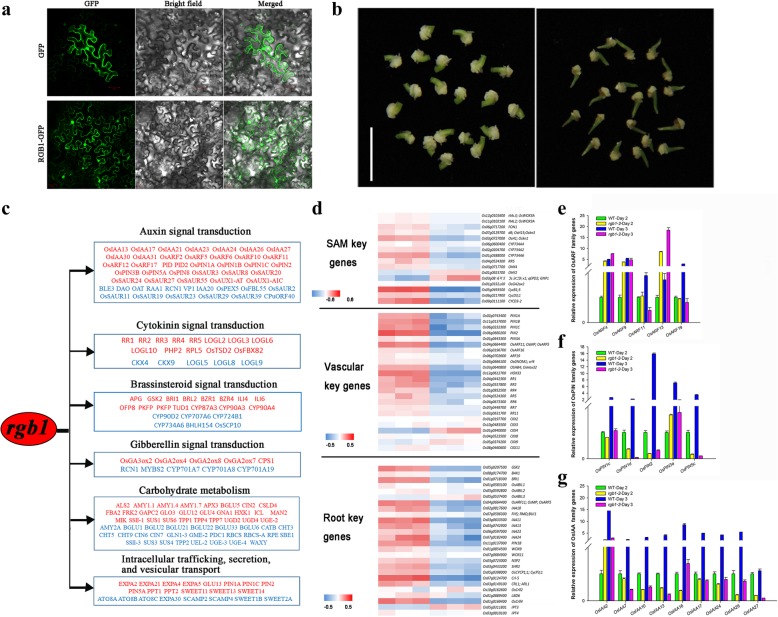
Fig. 6.
Transcriptomic analysis of young rice seedlings from wild type and rgb1 mutants. a Subcellular localization of RGB1. The localization of GFP alone and RGB1-GFP in N. benthamiana epidermal cells are shown. The images were obtained under an optical field to examine cell morphology (bright field), under a dark field to localize green fluorescent protein (GFP), and in combination (merged). M, membrane; N, nucleus. Bars = 50 μm. b Tissues of WT and the rgb1–2 mutant used for RNA-seq and qRT-PCR. c Representative genes with known functions (Additional file 11: Table S6, genes with demonstrated functions) in various response/regulatory pathways. The genes whose expression is downregulated or upregulated in the rgb1–2 mutant and WT are shown in red and blue, respectively. d Hierarchical clustering displays of genes specifically expressed in the SAM, vascular tissue, and roots of the rgb1–2 mutants compared with the WT control. The blue color indicates upregulation, and the red color indicates downregulation in the embryo; the white color indicates that the expression intensity was not detected. e-g Transcript levels of auxin signal transduction-related genes at 2 and 3 days after germination. e OsARF family genes. f OsPIN family genes. g OsIAA family genes

